THERMOCALC AveragePT Calculations
What is it?
The type of thermobarometry that THERMOCALC does relies on the calculation of multiple reactions based on an internally-consistent dataset. This has been termed 'optimal thermobarometry' or average PT (Holland & Powell, 1994)
Advantages of 'optimal thermobarometry' include its merit of consistency with other mineral equilibria methods (like pseudosections), the possibility of realistic assignments of uncertainties, and the recognition when there is little or no thermobarometric information in a mineral assemblage based on the statistical output.
How does it work?
In AveragePT, the thermodynamics of an independent set of reactions between the end members of the mineral assemblage (assumed to have been in equilibrium) is combined statistically (by a 'least squares' method) to give a PT result.
- The number of independent reactions = no. of end-members of phases - no. of system components.
- This statistical basis means that consistency of data being combined can be assessed (via regression diagnostics).
- This is not true for conventional thermobarometry.
- Leads to the possibility of realistic assignment of uncertainties (via the value of the fit parameter involved).
What does it actually do?
- write an independent set of reactions between the end-members of the phases of interest
- write 0 = ΔGo +RT ln K for each reaction with K being a product of the activities of the end-members
- determine ΔGo from an internally consistent thermodynamic dataset (often nearly linear function of P and T)
- consider activities of each of the end-members of the phases to be variable within their uncertainties
- each reaction then defines a PT band, the bands being correlated with each other via the activities
- then averagePT is the PT point that is as "close" as possible (in a least squares sense) to every reaction line
Goodness of Fit
- what separates the AveragePT approach is its ability to assess whether data (i.e. activities of end-members) being combined should actually be combined
- the key statistic, related to "goodness-of-fit", is σfit
- σfit = sqrt(MSWD)
- σfit is just a measure of how much the activities of the end-members have to be varied to make the reaction lines go through a single PT (the AveragePT)
- σfit is judged by a Χ2 test, a value that σfit should be less than for 95% confidence
- σfit depends on the size of the activity uncertainties: halving all the uncertainties doubles σfit
Strategies
- what are the variables? Usually PT, but also sometimes, e.g. XCO2 or aH2O
- what is least well known? (i.e. P or T?)
- run AverageP first, for a sensible T range
- is σfit good? if not, investigate why.
- is σfit minimized in T range? if so, try AveragePT
Methods
Old Way:
- run mineral assemblage though AX
- assemble THERMOCALC datafile
- run the calculation...>/li>
New Way:
- take mode 1 datafile a-x coding
- convert recalculated analyses into {x,y,z...}
- run!
Examples
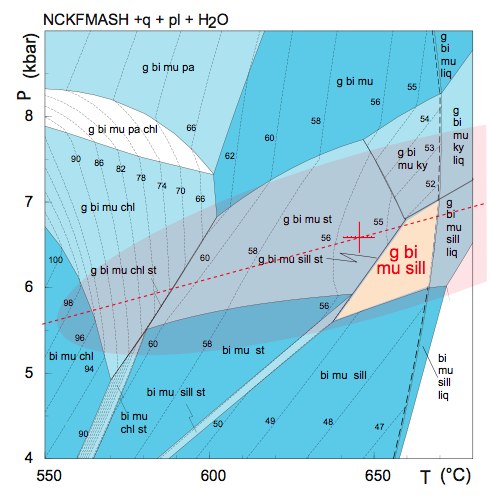
Let's look at an example with garnet-biotite Fe-Mg exchange as well as GASP. The assemblage is garnet-biotite-sillimanite-plagioclase-muscovite-quartz from the Eastern Alps (Habler & Thoni, 2001). We can see the shape of the phase relations using a PT pseudosection.
Summary
- AveragePT (and particularly AverageP) can certainly give thermobarometric information on low variance mineral assemblages
- Locating these relatively low variance assemblages is important thermobarometrically
- But, pseudosections are likely to provide the most powerful tools for thermobarometry


