Initial Publication Date: August 10, 2007
Activity Models
Introduction
Minerals may have many different compositions in nature and, therefore, the compositions of minerals must be considered when we apply thermodynamics to natural systems. Many minerals occur as solid solutions of two (or more) end members. For example, garnet is typically a solid solution of grossular (Ca3Al2Si3O12), pyrope (Mg3Al2Si3O12), almandine (Fe3Al2Si3O12), spessartine (Mn3Al2Si3O12), and even more end members.
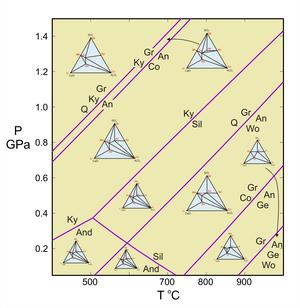 Figure 1. Petrogenetic grid for the system CaO-Al2O3-SiO2.
Download PDF (Acrobat (PDF) 26kB May27 07)
To appropriately address the compositional variation of minerals, and the effect of composition on mineral stability,we must introduce a new thermodynamic property, the activity of a component i in phase j: aij .
Activities are values that describe how reactive a particular end member component is for a given mineral composition. If a mineral is pure (for example, if a garnet is 100% grossular) the activity of the end member (in this example grossular) is 1. If a particular end member is only a minor part of a mineral, its activity will be very small. Activities depend, not only on composition, but also on pressure and temperature (P and T).
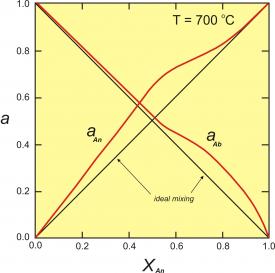 Figure 2. Activity-composition relationships for plagioclase at 700oC. This diagram modified slightly from the model of Orville (1972, Am. J. Sci. 272, 234-272).
Figure 2 (right) shows activity-composition relationships for plagioclase at 700oC. The red curves are the activities; the black lines would be the activities if plagioclase behaved as an ideal solution. This diagram shows that, unless plagioclase is close to end-member anorthite or albite, the activities (reactivities) of albite and anorthite are greater than would be predicted by ideal mixing.
Some Basic Relations
- Activity values may range from 0 to 1. An activity of 0 means that the component is not present in any amount. An activity of 1 means that the component is pure. (For example, the activity of anorthite in plagioclase is 1 if the plagioclase is 100% CaAl2Si2O8.) The activity of a component in a pure phase that does not exhibit solid solution is always effectively 1. For example, the activity of SiO2 in quartz, aSiO2qtz = 1. This is very convenient for applications to classical geothermobarometry and advanced modeling programs.
- An alternative way to think about a component's reactivity is to consider its chemical potential (μi). The chemical potential (μi) is related to the activity (a) of a component (i) according to the relationship: μi = μio + RTlnaij. In this equation, μi is the chemical potential of the component in a solid solution, μio is the chemical potential of the component in a pure end-member (the molar free energy of the pure phase), and aij is the activity of the component (i) in phase (j). Based on this relationship, one way to think about chemical potential and activity is that aij is a number between 0 and 1 describing the effective amount of a phase that is present, while μi is the reactive energy (usually expressed in joules or calories per mole) that component has.
- The activity of a component, aij, is related to the mole fraction of that component in a solid phase, Xij. Activity increases as mole fraction increases. This relationship applies to solids and also to components in aqueous solution or gaseous mixture. For example, the reactivity of a gas in a mixture increases as the gas's partial pressure increases. (The reactivity of a gas in a mixture is described by a term very similar to activity, fugacity.)
- Figure 3 (right) shows a activity-composition diagram for orthopyroxene solid solution. In each diagram the straight lines represent ideal behavior, and the curved lines show non-ideal deviation from the ideal case. As with the plagioclase example, above, the activities of the end members are generally greater than mole fraction. For relatively dilute solutions, the a-X relationships are close to linear, and this is the region where Henry's Law generally can be applied.
- In general, a mineral end member exhibits nearly ideal behavior at very low mole fractions or very high mole fractions. For such compositions, activity is approximately equal to mole fraction. For example, olivine compositions Fo98Fa02 or Fo02Fa98 have forsterite activities of about 0.98 and 0.02, respectively; the activity of forsterite for both compositions is nearly ideal.
- In general, mineral solid solutions have more ideal behavior at higher temperatures, and more non-ideal behavior at lower temperatures. If the extent of non-ideal behavior is large enough, unmixing or immiscibility may be seen at lower temperatures. If, for example, alkali feldspar end members mixed ideally, there would be no solvus in the alkali feldspar system.
Ideal and Non-ideal Behavior
- In an ideal solution, the activity is simply equal to the mole fraction: aij = Xij. (See below for more details about ideal solutions.)
- In a non-ideal solution, it is necessary to "correct" for this non-ideal behavior by applying an activity coefficient (γi), such that ai = γiXi. In the examples given above, all the activity coefficients are >1.
For example, consider volume as a proxy for activity in the simple case of mixing 50 ml of liquid A with 50 ml of liquid B. It seems that the final volume should be 100 ml, but in real solutions, the final volume may be 110 ml (positive deviations from ideality) or 90 ml (negative deviations from ideality). Deviations from ideality are seen, not only in volumes of mixing, but also in the Gibbs free energy of mixing. Imagine the liquid A50B50 participates in a chemical reaction. The solution may "act" as if the composition is A60B40 rather than A50B50.
Mineral End Member Activity
Many minerals exhibit non-ideal mixing because of interactions on the atomic level. For many thermodynamic calculations, this effect is large enough that it must be included. So we need to know the activities of the end members we are considering.Because the activity of a component or end member in a mineral solution is defined as:
ai = γiXi
what we generally seek to know are values for activity coefficients, γi. The values vary, depending on pressure, temperature and composition of the phase involved (P, T and X). We determine them on the basis of experimental studies and thermodynamic calculations.
Solution Models
The relationships between P,T,X and activity coefficients (or activities) can be quite complicated. Consider Figures 2 and 3 above -- the activity-composition curves seem linear in some places and not in others. Deviations from activity are greater for some compositions, and less for others. If we were to look at the same diagrams for different PT conditions we would find even more variability. So, we need a way to calculate activities under a wide range of conditions. We do this using activity models, but we recognize that the models have limitations. They are, in effect, just equations that we have fit to available experimental and thermodynamic data. An overarching goal is to have models that are accurate enough so that any errors in calculated activities are insignificant, but simple enough so we can evaluate them with having to do complex calculations.
Ideal Mixing
The simplest model is ideal mixing. For ideal solutions, γi = 1 in all cases, and mole fraction of mineral end members can be used in thermodynamic calculations: ai = Xi. For such solutions, the Gibbs energy of mixing, Gmix is given by:Gmix = Gideal = RT(X1lnX1 + X2lnX2 + . . . + XnlnXn)
Gideal refers to the energy of ideal mixing, and the Xi values are the mole fractions of the components in solution.
If only life were always this simple all the time! In reality, ideal mixing can sometimes be assumed if concentration of a component is close to 1. It may or may not work for the Henry's law region, depending on the Henry's law constant.
Symmetric Solution Model
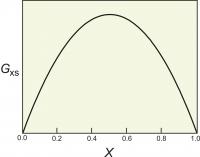 Figure 4. The excess energy of mixing, calculated for a symmetrical solution model, with WG=2000 cal (8.368 Kj). The top of the curve is at 250 cal (1.046 Kj).
Gmix = Gideal + Gexcess = Gid + Gxs
where the two terms on the right hand side refer to the ideal and excess contributions to the energy of mixing. The ideal contribution is calculated using the equation above. The excess contribution is calculated using an activity model. Free energies are measured in units of calories (cal) or joules (j); one calorie = 4.184 j and 1000 cals = 4.184 Kj.
One relatively simple activity model is to assume that the excess energy of mixing is symmetrical. For a binary solution, this means that the excess energy peaks for a 50:50 solution and decreases symmetrically toward each end member (Figure 4). This can be described mathematically:
Gxs = WGX1(1-X1)
where X1 is the mole fraction of one of the end members.
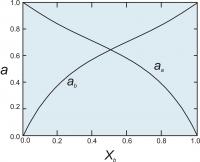 Figure 5. Activities of end members in a two component symmetrical solution with WG = 2000 cal (8.368 Kj).
WG = WG + PWV -TWS
where the WV and WS terms are symmetrical terms describing the excess volume and entropy of mixing.
For a binary symmetrical solution containing components A and B, the activity coefficients (γ's) of components A and B are calculated from the equations:
RT ln γA = WG(1-XA)2
RT ln γB = WG(1-XB)2
Once we have the activity coefficients, we can calculate the activities (Figure 5) using the relationship ai = γiXi.
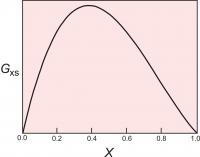 Figure 6. The excess energy of mixing, calculated for an asymmetrical solution model, with WG1=1000 cal (4.184 Kj) and WG2 = 4000 cal (16.736 Kj). The top of the curve is at about 700 cal (2.929 Kj).
Asymmetric Solution Model
The asymmetric solution model assumes that the excess energy of mixing of a binary solution containing components A and B can be described by:Gxs = XAXB(WG1XB + WG2XA)
In this model, we have two Margules parameters (W values) instead of one as we did with the symmetric model. A curve describing the excess energy has a distorted parabolic shape, peaking at some composition other than X=0.5 unless WG1 = WG2 (Figure 6). For this model, the activity coefficients are calculated as:
RT ln γA = (XB)2(WG1+2XA(WG2-WG1))
RT ln γB = (XA)2(WG2+2XB(WG1-WG2))
Figure 7 shows calculated activities for a binary solutions with the two Margules parameters equal to 1000 cal (4.184 Kj). and 4000 cal (16.736 Kj).
As with the symmetrical model, the W values may be assumed constant, or may vary with P and T.
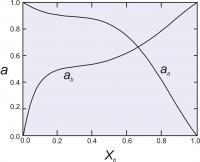 Figure 7. Activity-composition relationships calculated for as asymmetrical solution model, with WG1=1000 cal (4.184 Kj). and WG2 = 4000 cal (16.736 Kj).
More Complicated Models
The symmetric and asymmetric models described above are not sufficient to describe the mixing of plagioclase (Figure 2). They might be good approximations for orthpyroxene, depending on the accuracy we require. For these and many other mineral solutions, it is often necessary to use more complicated activity-composition models. There are many to choose from, and some require complex computer programing. For more information, see the discussion in Frank Spear's Metamorphic Phase Equilibria and Pressure-Temperature-Time Paths (Mineralogical Society of America Monograph 1993).How Do We Use Activity Models?
Because many reactions that affect real rocks involve minerals with solid solutions, activities and activity models are needed to make meaningful thermodynamic calculations. Activity models are essential for application of advanced thermodynamic modeling programs, and more basic geothermometers or geobarometers. For example, the reaction between anorthite, grossular, kyanite and quartz is often used to calculate the pressure at which a rock equilibrated:
3 anorthite = grossular + 2 kyanite + quartz
If a rock contains pure anorthite, grossular, kyanite and quartz, then the reaction takes place where shown in Figure 1 (above). However, most for most rocks that contain plagioclase, garnet, kyanite and quartz, the plagioclase only contains a small amount of anorthite, and the garnet only contains a small amount of grossular. Consequently, the reaction does not take place at the conditions shown in Figure 1 but, usually instead, at lower pressures.
To calculate the pressure at which this reaction takes place requires knowing the activities of the phases involved. Once the activities have been determined, the equilibrium constant (K) may be calculated. K is the product of the activities of the reaction products, divided by the product of the activities of the reactants (and with each activity raised to the power of its stoichiometric coefficient in the reaction):
For the reaction involving anorthite, grossular, kyanite, and quartz (the GASP barometer), the equilibrium can be expressed with the equilibrium constant as:

In the above equation, the last ratio (after "ln") is the equilibrium constant. It involves only the activities of grossular and anorthite because kyanite and quartz are pure (and so have activities = 1).
Figure 8 shows how the equilibrium for the GASP barometer varies according to the equilibrium constant (the contoured lines showing the range of values for K). The activity constant is used to calculate the PT location of the reactions. This diagram shows the relationship between the composition of minerals in a natural assemblage, how these compositions are represented as activities and are related by the equilibrium constant (K), and their relationship to the physical conditions (pressure and temperature).
As a simple example, consider a rock that contains plagioclase with a composition of An20 (XAnPl = 0.2) in equilibrium with a garnet with 8% grossular component (XCagar =0.08) (and quartz and kyanite must also be present in the rock, but they are pure phases so their activities will be one). If we assume ideal mixing (all activity coefficients = 1), K = [.08]/[.2]3 = 10. If we have an independent temperature estimate from geothermometry we can read the estimated pressure directly off the graph (e.g. at 500oC, the estimated pressure would be 0.8 GPa).
For more details of how activity models are used to calculate mineral equilibria, see the thermodynamics calculation page and applications to geothermobarometry. These principles are used in the advanced modeling programs such as ThermoCalc, Melts, PERPLEX and TWQ, although the activity models used in these programs can be quite complex and require top-end computational capabilities.
Related Resources
- Dave Waters' tutorial on Solid Solutions, Mixing and Activities


