
The Extreme Weather baMEL
The Models
Model A: The number and strength of extreme weather events vary naturally. Human activities release carbon in the atmosphere. Yet, plants and oceans absorb any carbon increases.
Model B: Increases in extreme weather events are linked to climate change. Current climate change is mainly caused by human activities, such as fossil fuel use.
Model C: Over time, increases and decreases in extreme weather events are mainly caused by changes in Earth's orbit around the Sun.
Student Handouts
- Extreme Weather baMEL Model Plausibility Ratings (Acrobat (PDF) 148kB Jul10 25)
- Extreme Weather baMEL - Model Cards (Acrobat (PDF) 129kB Jul31 24)
- Extreme Weather baMEL - Large Model Cards (Acrobat (PDF) 144kB Jul31 24)
- baMEL – Diagram (Acrobat (PDF) 183kB Jun26 25)
- Explanation Task (Acrobat (PDF) 52kB May6 24)
Lines of Evidence
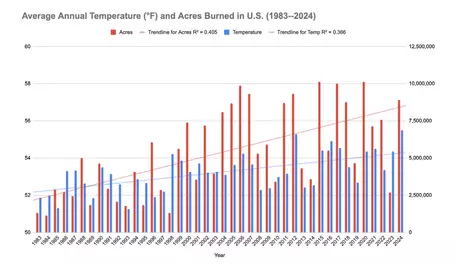 Evidence #5. Average number of acres burned by large fires together with average annual temperature. Source (fires): https://www.nifc.gov/fire-information/statistics/wildfires
 ![[creative commons]](/images/creativecommons_16.png)
Evidence #1: Since 1958, Earth's atmosphere and oceans have changed. The amount of carbon released to the atmosphere has risen. Dissolved carbon in the ocean has also risen. More carbon has increased ocean acidity and coral bleaching.
Evidence #2: From 1910 to 1995, record rainfall events increased across the United States. Over the same time period, there was a sharp increase in the amount of carbon released to the air. Much of this carbon comes from fossil fuel use.
Evidence #3: Ocean surface temperatures have increased since about 1970. In the North Atlantic, tropical storm power has also increased over this same time period. A storm's power depends on its strength and how long it lasts.
Evidence #4: Since 2012, there have been more intense, extreme weather events around the world. Europe had the second-highest yearly temperature on record. The South Central United States had the costliest cold wave on record. The decade from 2013 to 2023 was the warmest. ever since pre-industrial times.
Evidence #5: Since 1983, the number of fires each year in the U.S. has not changed. The number of acres burned by those fires has increased. Also, since 1983, the average annual temperature in the U.S. has increased.
Evidence #6: In the last 100 years, global temperatures have increased. In that same time period, heavy precipitation events have also increased.
Evidence #7: The amount of ocean ice has declined, with the Arctic warming at a pace two to three times the planet's average. At the same time, record cold temperatures and snowfall have occurred in Europe and Asia.
Evidence #8: Earth's orbit is elliptical. But, the shape of the ellipse is almost a perfect circle. In the Northern Hemisphere, Earth is slightly closer to the Sun in winter than in summer. Earth's surface receives more sunlight in summer than in winter.
Student Handouts
- Extreme Weather baMEL – Evidence Texts (Acrobat (PDF) 1.5MB Jul10 25)
- Extreme Weather baMEL – Evidence Cards (Acrobat (PDF) 136kB Jul10 25)
- Extreme Weather baMEL – Large Evidence Cards (Acrobat (PDF) 136kB Jul10 25)
Virtual baMEL
The Google Drive folder below contains MEL resource documents in the Google formats. In order to maximize the flexibility of our activities, the MEL Project Team wanted to make more resources compatible with virtual settings. We have made our MEL scaffolds available in Google formats, so that they can be copied, modified, and uploaded more easily on a variety of platforms and devices. Please note that to access all the materials for each MEL scaffold, you will need a Google account. View the README file first.
- README First Instructions & FAQ (Acrobat (PDF) 70kB May24 21)
- Virtual Extreme Weather baMEL Resource Documents in Google Drive