How Students Engage the Data
Engaging Data
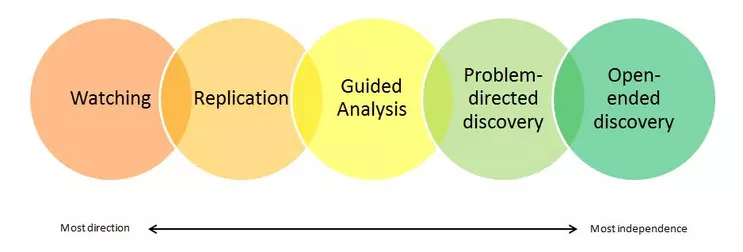
The image below describes the various ways students engage data as a continuum along the dimension of guided direction and student independence. Typically, students with little prior experience with data-based problem solving will find it helpful if they are given more direction. Indeed, the ability to independently generate an hypothesis is a very advanced skill that even graduate students find challenging. In deciding how much guidance to give your students, consider their prior experience in conjunction with your course's learning goals. Read below for more on each category; watching, replication, guided analysis, problem-directed discovery, and open-ended discovery.

Watching
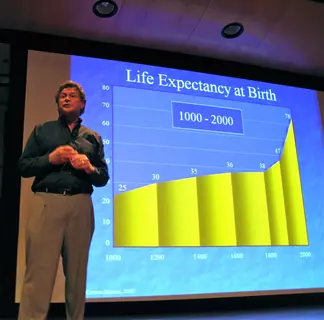
On the far left of the spectrum, we see that students can learn by watching. Professors can look for opportunities in their classes and lectures to model good data analysis. For instance, they might project a visual representation of data and then show students how to break the information down. Obviously, this is not a particularly active form of learning, and so by itself the mode of watching won't likely accomplish all of the goals for teaching with data. But when combined with other modes of teaching with data, such demonstrations can reinforce many lessons. Because students are less active in this mode, it is important to call students attention to the connections. Consider something like, "On the last assignment I asked you to analyze the information in Schwartz's Figure 2. Let me walk you through how I would unpack Figure 7 from the Smith article." Similarly, it can be helpful if you make your thought process explicit. While some students can simply see what you are doing, others will need it explained.

Replication
Replication represents the next most directed form of engagement. This could be replication of the key table from a published study or a "canned" experiment using data that the professor has "cleaned". In either case, students have no control over the question being asked or the method for answering it. This firm direction gives them freedom to focus on other aspects of working with data. For example, methods sections of published articles are usually very linear and terse. When confronted with the actual underlying data, students quickly figure out that there are actually many choices that needed to be made before the data were prepared for analysis. This is a powerful lesson. Clear direction also allows students to focus on the required method--how it actually works, what assumptions or uncertainties are involved, etc.
Guided Analysis
Guided analysis requires students to take on slightly greater independence. Without a prescribed outcome in front of them or (perhaps) a prescribed method, students must make more decisions about how to proceed. Teaching guidance may be provided in the interpretation of the data, testing of hypotheses, prediction-making, or all three. The teacher's intervention in the student experience with the data provides framing for the student to help them ask the right kinds of questions.
Problem-Directed Discovery

You don't need to give a large assignment to engage students in problem-directed discovery. For example, one important part of discovery is generating conjectures. As the Making and Teaching Conjectures module shows, this can be done in the context of a lecture. Just provide a little space for students to create their own conjecture--and maybe ask them to share with a neighbor--before you go on to show what the data actually show.
Open-Ended Discovery
Finally, open-ended discovery represents the most independent form of student engagement with data. Here students must come up with their own questions to ask of the data to uncover patterns that point to understanding of theory or process. While this undirected exploration is most often seen among students with previous problem-solving experience, it can also be a way to introduce very novice students to an area of the discipline. It allows them to achieve a personal sense of what patterns exist that we are trying to explain.
While most advanced research falls in the category of open-ended discovery, don't be fooled into thinking this means introductory students can't play this exciting game. Melissa Eblan-Zayas provides a wonderful example of how a standard intro physics lab on springs can be turned into open-ended discovery. If space, time, and resources are a limited, you could imagine Melissa's students completing their spring lab with this java visualization from the PhET Interactive Simulations collection.
