Measuring Plate Motion with GPS: Iceland | Lessons on Plate Tectonics
Summary
Context
Audience

![[creative commons]](/images/creativecommons_16.png)
Skills and concepts that students must have mastered
Students should be familiar with graphing. The lesson has an optional prequel, "Introduction to graphing of GPS data," designed for students who cannot yet graph earth science data skillfully or confidently. Its first two parts teach students to graph position vs. time, and its last part dovetails with this lesson. It teaches about velocity vectors by graphing position data over five years.
How the activity is situated in the course
This lesson falls after "Plate tectonics preview," teaching students about GPS in the context of divergent plate boundaries. It is designed as a sequence of exercises.
PREQUEL ACTIVITY: Introduction to Graphing GPS Data
This lesson has an optional prequel, "Introduction to graphing of GPS data," designed for students who cannot yet graph earth science data skillfully or confidently. Its first two parts teach students to graph position vs. time, and its last part dovetails with this lesson. It teaches about velocity vectors by graphing position data over five years.
RELATED LESSON: Exploring Plate Motion and Deformation in California with GPS
The next lesson in this sequence is Exploring plate motion and deformation in California with GPS
It is expected to take two class sessions (45 - 55 minutes).


Goals
Content/concepts goals for this activity
Students will be able to:
- Model and describe the general set up of a GPS—how monuments receive signals from multiple satellites
- Explore tectonic plate motions via velocity vectors on GPS Velocity Viewer.
Higher order thinking skills goals for this activity
- Interpret time series plots (position vs. time) qualitatively and quantitatively and represent time series data as velocity vectors, to scale, on a map
- Add vectors graphically to create a total horizontal velocity vector
- Make geological sense of two specific total velocity vectors in Iceland
- Apply knowledge of time series graphs to an abstract map
Skills goals for this activity
Not applicable
Description and Teaching Materials

Summary: This lesson teaches middle and high school students to understand the architecture of GPS—from satellites to research quality stations on the ground. This is done through the use physical models and a supporting presentation. Building on this knowledge, students then learn to interpret data for the station's position through time ("time series plots"). Students represent time series data as velocity vectors and add the vectors to create a total horizontal velocity vector. They apply their skills to discover that the Mid-Atlantic Ridge is rifting Iceland. They cement and expand their understanding of GPS data with an abstraction using cars and maps. Finally, they explore GPS vectors in the context of global plate tectonics.
The lesson has an optional prequel, "Introduction to graphing of GPS data," designed for students who cannot yet graph earth science data skillfully or confidently. Its first two parts teach students to graph position vs. time, and its last part dovetails with this lesson. It teaches about velocity vectors by graphing position data over five years.
Organization:This lesson consists of three core parts:
- Modeling GPS stations (or "monuments") and the satellite network that feeds time signals to the monuments.
- Making sense of GPS data: understanding time series data in order to develop total horizontal velocity vectors for Iceland.
- Applying knowledge in a more abstract way and on a global scale.
Lesson Overview:
- Activation of prior knowledge related to GPS is followed by a PowerPoint presentation: Measuring plate motion with GPS: Introducing GPS to study tectonic plates as they move, twist, and crumple.
- The teacher and students cooperatively create and work with model GPS monument and the satellite network that feeds time signals to the monuments.
- Students analyze and interpret GPS data, using time series plots in order to develop total horizontal velocity vectors of plate motion in Iceland.
- Extension: using the Velocity Viewer, students explore a map interface and interpret GPS velocity vector data around the world to identify other divergent zones and other plate motions.
- As a summative activity, students apply knowledge in an abstraction using cars and maps and explore GPS vectors in the context of global plate tectonics in the GPS Velocity Viewer.
Lesson Resources
Student and teacher files are available as PDF's. Should you need editable documents, please contact education @ earthscope.org
- Measuring Plate Motion with GPS: Iceland - Teacher Guide (Acrobat (PDF) 2.7MB Jun12 22) (Version May 2022)
- Measuring Plate Motion with GPS: Iceland - Student Guide (Acrobat (PDF) 4.8MB Jun12 22) (Version May 2022)
A supporting presentation in both PDF and PowerPoint formats is also available Measuring Plate Motion with GPS: Iceland - Presentation (Zip Archive 14.4MB Jun12 22)
Teaching Notes and Tips
Before you begin...
Students need a general understanding of plate tectonics for this lesson. Many excellent learning resources are available online covering evidence that support the theory of plate tectonics. Many of these resources take a global view of plate tectonics; this lesson explores how high-precision GPS can be used to measure regional plate movement and deformation.
Teaching tips and general background:
A variety of geologic phenomena including earthquakes, volcanic eruptions, and mountain building occur at plate boundaries, all of which cause the Earth's surface, the crust, to deform. When deformation occurs, points on Earth's surface change location (north-south, east-west, up-down). Precise GPS instruments can measure the change in position. Earth scientists use this data to record how much and how quickly Earth's crust is moving due to plate tectonics and to better understand the underlying processes of the deformation.

Before starting the lesson, review these videos on how to demonstrate how GPS works:
- In addition to following the steps below, watch this video, How GPS Works to Pinpoint Location (https://youtu.be/hqxwYWr879s) on pinpointing location with GPS. Then watch this video (http://bit.ly/HowGPSworks-demo) on YouTube that demonstrates how to build a monument (the second half also suggests ways to demonstrate how a GPS monument gathers location information). Note: it is more accurate to use 4 satellites to find the precise position. These videos are meant to inform the instruction of teachers, not to be shown to students.
- A second video( https://bit.ly/GPSdemo-part3) on YouTube provides background for teachers about time series plots. (On YouTube search for "GPS gumdrop activity 3-5.") .
Key points for the demonstration
- Satellites are in orbit above Earth's surface at an altitude of 20,200 km (12,600 mi)
- Each satellite sends a signal many times a second and 'talks' to the GPS antenna (note, the GPS station does not send any signals back to the satellite); the GPS receiver calculates how long it takes for the signal to reach the antenna and then calculates the distance between the satellite and antenna.
- The string represents the distance between the satellite and a monument after this distance is calculated.
- The GPS needs 4 satellites to find its position on Earth.
- With one satellite, the GPS could be anywhere on the surface of a sphere with a radius equal to the distance between the GPS and the satellite.
- With two satellites, the monument could be anywhere on the circle of the two intersecting spheres.
- With three satellites, the GPS could be at one of the two points where three spheres intersect. The Earth is the fourth sphere (the satellites know where the Earth is).
- Since time is part of the calculation to find a position, a 4th satellite provides even more precision in location to correct position errors caused by in clocks on the satellite and GPS.
- These measurements are being made while satellites are moving at 2 kilometers/second!
- Review this video for teaching:NASA's Brief History of Geodesy (http://bit.ly/nasawhatisgeodesy).
Assessment
Formative assessment of student understanding can be gathered from classroom observation and discussions with individuals or small groups.
Ask students to summarize the activities they have done. Discuss the connection to plate tectonics and the increasing role GPS is playing in studying current tectonic events. This could be done in writing, as a Think-Pair-Share, in an interactive web project, or as a whole class brainstorming session. This discussion can act as summative assessment; of course you can also grade their lab sheets.
If opting to have the student exercise serving as a summative assessment for the activity, answer keys are provided along with a suggested grading scale. Some questions have clearly correct answers. For open-ended questions, students can be assessed based on a simple 2-point scale.
- 2 points = correct answer with thorough supporting evidence and/or complete description
- 1 point = answer not completely correct or lacking thorough supporting evidence or description
- 0 points = incorrect answer
Exercise answer keys can be found on pages 5-19 of the combined teacher guide listed under Resources Measuring Plate Motion with GPS: Iceland - Teacher Guide (Acrobat (PDF) 2.7MB Jun12 22)
References and Resources

- HOFN GPS Station:
- HOFN time series data link under 24 hour final solutions, IGS14, as env (east-north-vertical). The time series data is in ascii text, available through the Nevada Geodetic Laboratory, University of Nevada-Reno.
- HOFN Time series plot (link to Nevada Geodetic Laboratory, University of Nevada Reno or click thumbnail to download)
- HOFN station page with additional reference frames, station plots, and data solutions. Source: Nevada Geodetic Laboratory, University of Nevada Reno.

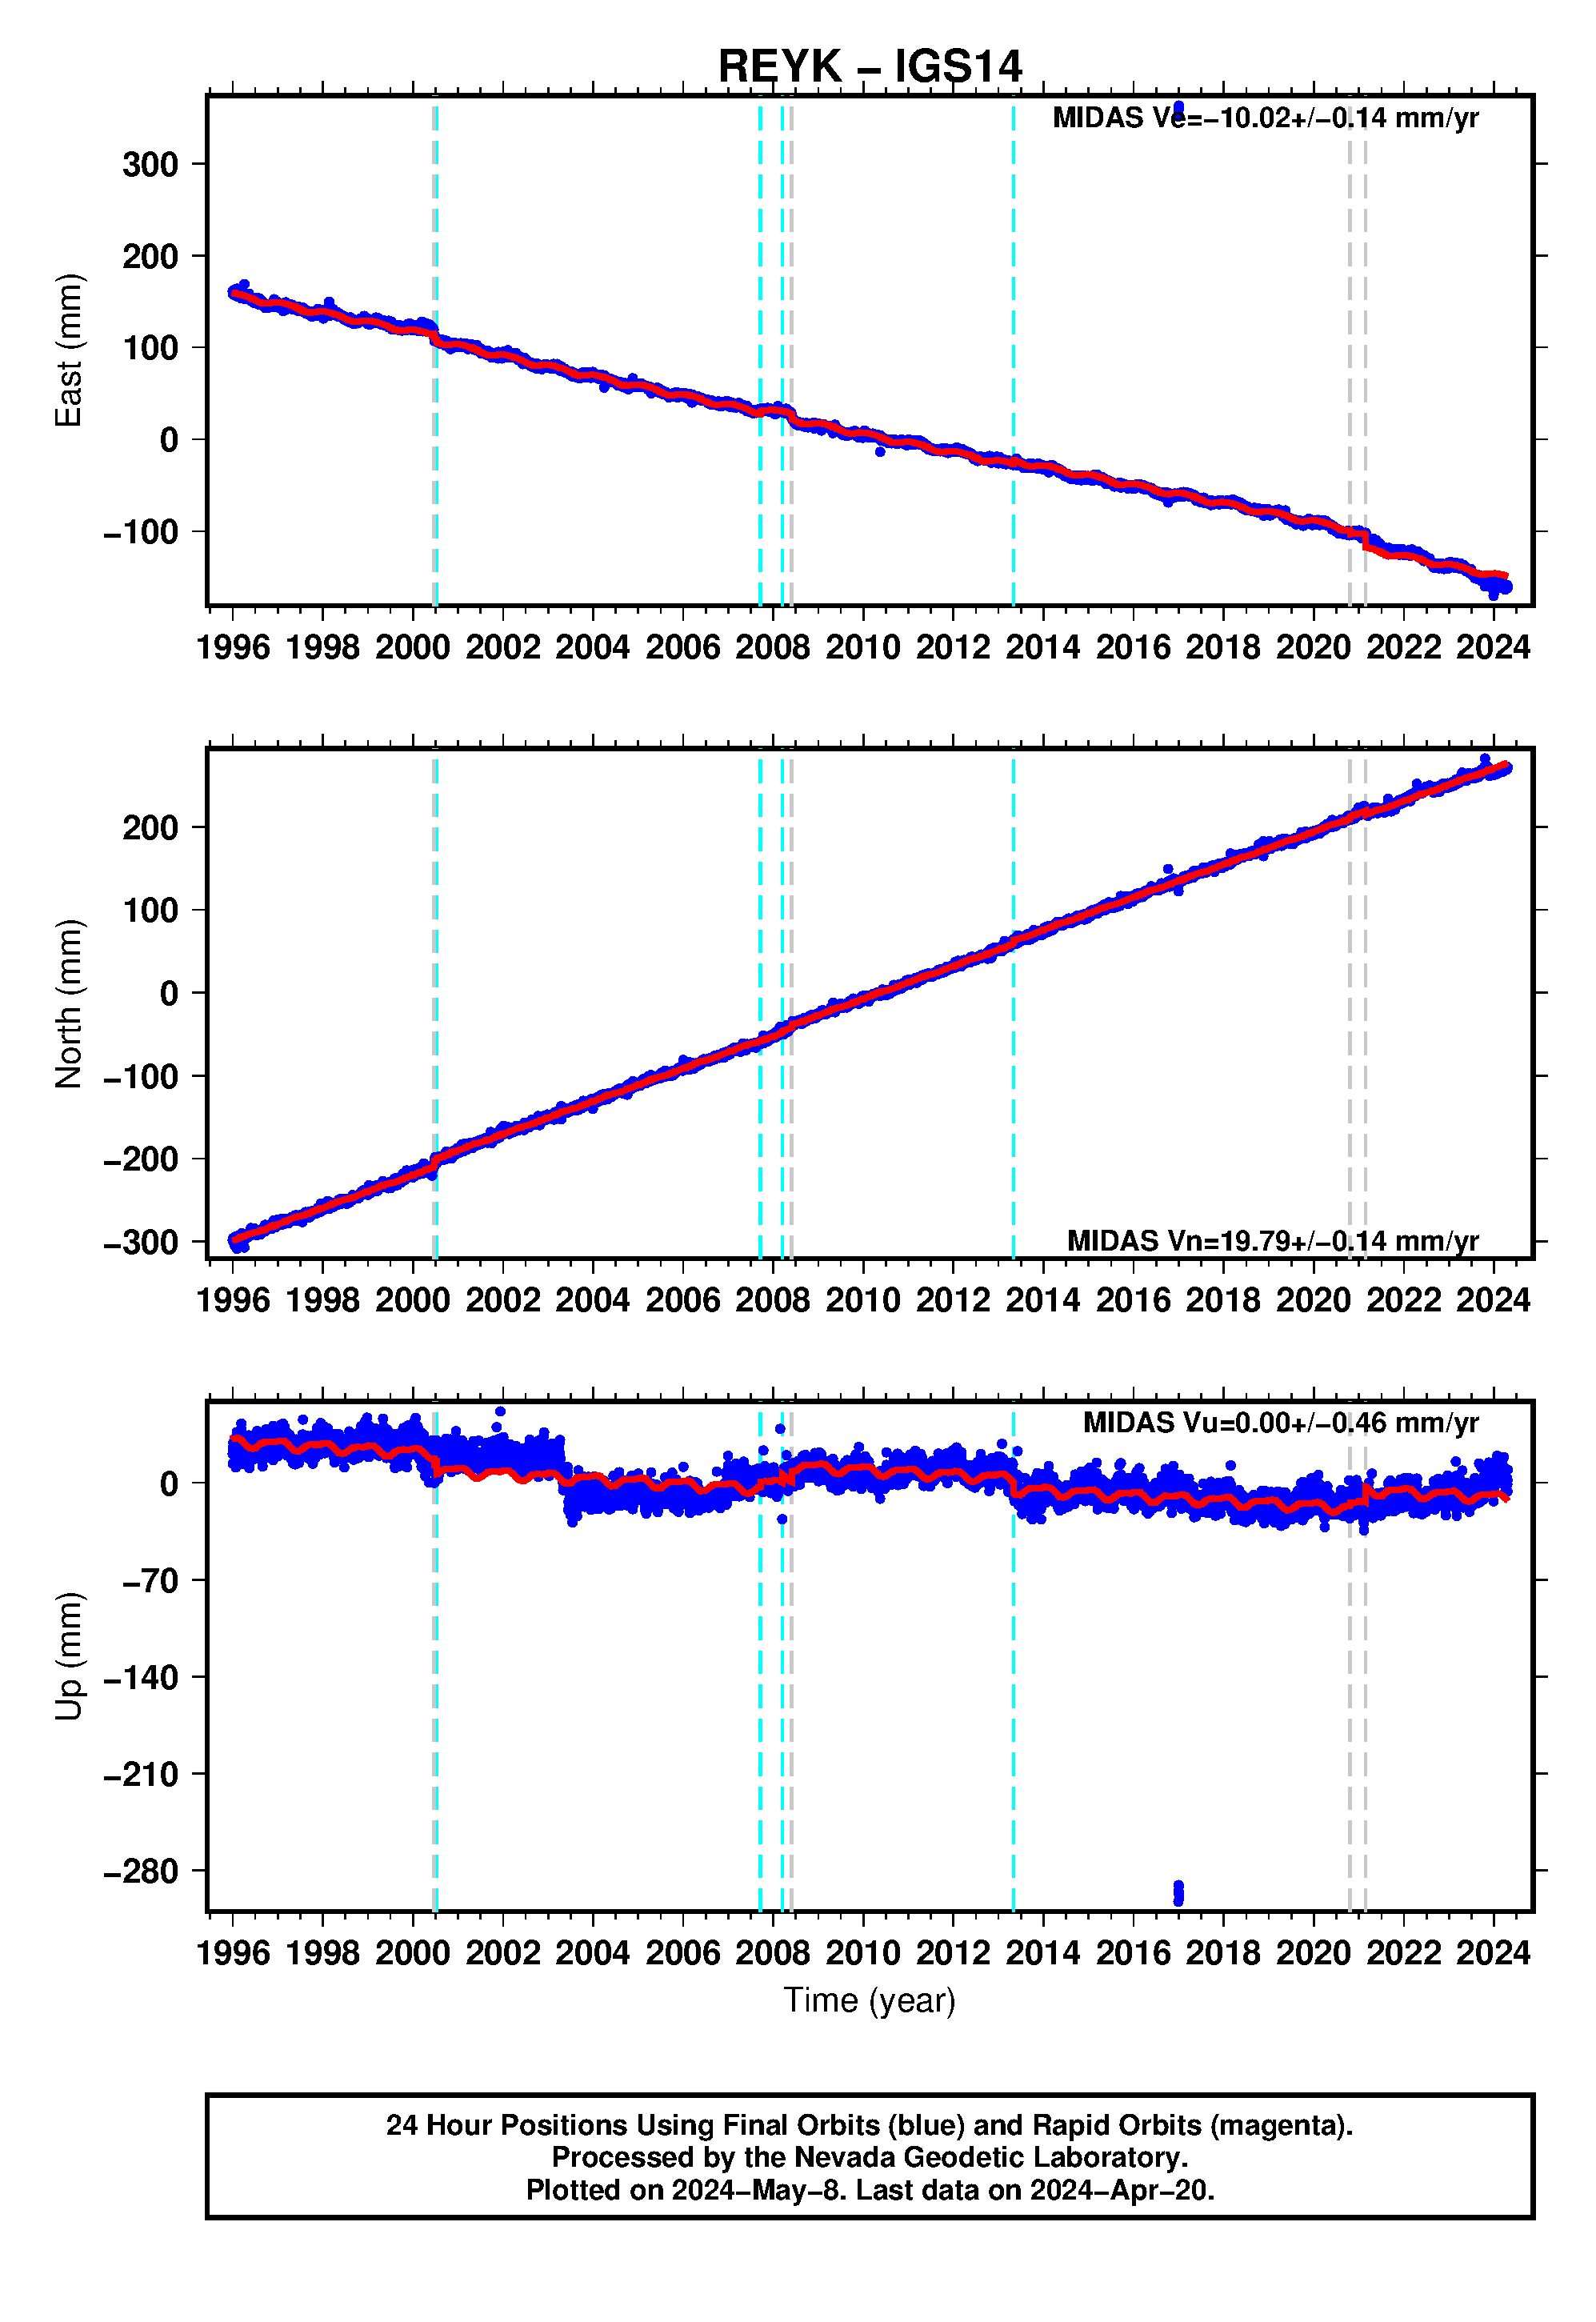
- REYK GPS Station:
- REYK time series data link under 24 hour final solutions, IGS14, as env (east-north-vertical). The time series data is in ascii text, available through the Nevada Geodetic Laboratory, University of Nevada-Reno.
- REYK Time series plot (link to Nevada Geodetic Laboratory, University of Nevada Reno or click thumbnail to download)
- REYK station page with additional reference frames, station plots, and data solutions. Source: Nevada Geodetic Laboratory, University of Nevada Reno.