
Unit 3: How to see an earthquake from space (InSAR)
Summary
How can we tell what style of faulting was responsible for a particular earthquake? Especially in cases where there is limited instrumentation in a region, or where geologists have difficulty accessing the affected areas? What if the fault responsible does not break the surface? In this unit, we will show how modern space geodesy allows us to measure movements of Earth's surface over wide areas without the need to visit the region in question, and we will demonstrate the various Earth processes that we are able to measure and monitor in this way. Specifically, we will show how a technique known as Interferometric Synthetic Aperture Radar (InSAR) has revolutionized our ability to study earthquakes on the continents, by allowing us to measure where, over what spatial extent, how far, and in what direction, earthquakes have caused the ground to move.
Learning Goals
Unit 3 Learning Outcomes
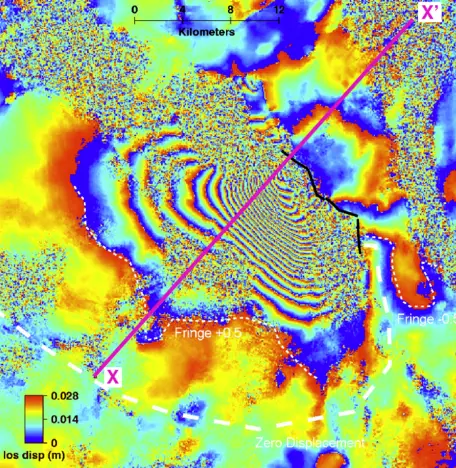 Interferogram of the Dinar, Turkey 1995 earthquake. InSAR allows for the measurement of topographic change over a broad area. Data processed by Gareth Funning.
![[creative commons]](/images/creativecommons_16.png)
- Students will relate the displacement of Earth's surface and the line-of-sight displacement measured by InSAR.
- Students will infer the locations, amplitudes and mechanisms of Earth processes by interpreting real interferogram data.
- Students will relate short-term deformation processes (as recorded by InSAR) with long-term deformation processes (as recorded in the landscape), and hypothesize potential reasons behind any differences.
Unit 3 Teaching Objectives
- Cognitive: Promote student ability to explore and visualize the relationship between the displacement of Earth's surface and the line-of-sight displacement measured by InSAR.
- Behavioral: Facilitate students in interpreting InSAR data (radar interferograms) in terms of magnitude of displacement and/or displacement rate, spatial pattern, and spatial extent, and making inferences about the underlying Earth processes.
Context for Use
The content in Unit 3 is appropriate for advanced geology/geoscience courses conducted at the junior and/or senior-level in which geodesy data can be introduced in conjunction with traditional presentations of material on faults and faulting; this would typically be in a course on structural geology but could also be part of a course on tectonics, geomorphology, geophysics, or advanced geohazards. The Unit 3 activities can be readily adapted for a lecture or lab setting as a series of interactive lecture activities, a lengthier in-class activity, or as part of a laboratory investigation of the use of geodesy to understand faulting and the recognition of active fault types. If the entire two-week module will not be utilized, Unit 3 can be used as the start of a shortened two-unit sequence on InSAR, paired with Unit 4: The phenomenology of earthquakes from InSAR data to give students an opportunity to learn the background of InSAR and then apply that knowledge to investigating the specific characteristics of fault geometry and displacement for specific earthquakes.
Description and Teaching Materials
This unit contains instructional, discussion and practical elements.
Part 1:
For students who are unfamiliar with InSAR data and the underlying principles, a short PowerPoint presentation is provided. It could be incorporated into a longer lecture on faulting styles, presented as a standalone mini-lecture at the start of a lab class, or provided to students to study out of class.
Presentation on the background theory of InSAR (PowerPoint 2007 (.pptx) 8.8MB Oct2 23)
This is a ~25-slide presentation that could be incorporated into a lecture setting, presented at the start of a lab, or provided to students for independent review, designed to provide an accessible introduction to SAR and InSAR. The presentation includes supplemental information in the form of additional comments included as slide notes, in order to assist instructors with their presentation of the material. It is also provided in the form of a handout, where the slides are accompanied by the notes.
'How does InSAR work?' handout with slides and notes (Acrobat (PDF) 1.9MB Oct2 23)
Part 2:
In order to deepen students' understanding and/or encourage reflection upon the material, a set of questions is provided. These could be used in a classroom setting, for example in think-pair-share exercises, or in group discussions, or alternatively could be given as a homework exercise to students and subsequently discussed in class time. In either case, these questions are intended as a means of low-stakes formative assessment, rather than a rigorous evaluation of student understanding. These questions are the primary assessment for this unit.
Questions for discussion or formative assessment (Microsoft Word 2007 (.docx) 291kB Nov28 15)
Part 3:
Students will gain hands-on experience with interpretation of InSAR data of a real earthquake (the M6.4 1995 Dinar, Turkey event). This can be conducted purely as a paper exercise, or, if computer access is possible, the imagery can also be manipulated and viewed within Google Earth.
- First, students are asked to identify the expected style of faulting from the topography (building on insights gained in Unit 2).
- Students are then asked to estimate the maximum surface deformation that occurred on either side of the fault, and use this information to estimate the uplift, subsidence, throw and slip that occurred in the earthquake.
- Next, students are asked to construct a displacement profile across the interferogram (in essence, an exercise in interferometric phase unwrapping).
- Finally, a comparison is made between the earthquake deformation profile and the topography along the same profile. Students are asked to relate the short-term deformation due to the earthquake to the long-term deformation recorded in the landscape, estimating the number of earthquakes necessary to form that topography and to suggests reasons for any differences in the shapes of the two profiles.
Files:
Lab exercise handouts, including instructions and questions for the lab exercise.
Unit 3 student exercise (Microsoft Word 2007 (.docx) 361kB Nov29 15)
Unit 3 Student exercise additional handouts (Zip Archive 1.3MB Nov29 15)
Google Earth KMZ files of Dinar interferograms (to be optionally used in the lab exercise).
Dinar Google Earth KMZ files (Zip Archive 562kB Apr6 15)
Interferogram files of additional earthquakes (Christchurch, New Zealand; Xizang, China; Kilauea, Hawaii; Myanmar; Simeulue, Indonesia; Iran; Wells, Nevada) if a broader range of examples is useful (to be optionally used in the lab exercise).
InSAR KMZ files of additional earthquakes (Zip Archive 22.2MB Apr6 15)
InSAR poster files of additional earthquakes (Zip Archive 19.8MB Apr6 15)
InSAR metadata file (Excel 2007 (.xlsx) 36kB Apr6 15)
Teaching Notes and Tips
This presentation can be used to walk students through the Dinar Earthquake fringe-counting part of the student exercise after they have completed it or it can simply be used by the instructor to aid in grading.
If the students end up using Google Earth, some good general Google Earth tutorials for both the instructor and the student can be found on the SERC site.
Some tips specifically for this exercise (as detailed in the student assignment):
You can adjust the transparency of the image overlay—if you want to see some of the detail of the underlying imagery—by editing the overlay using Get Info or Properties (depending whether you are using the PC or Mac version). [About 30% transparency tends to be a good compromise.] Look in particular for the locations of mountains and lakes around the epicentral area, which are diagnostic of the tectonic setting and style of faulting.
Using the Path tool, it is possible to draw a cross-section along a chosen line:
- First you must make a path. The Path tool is located in the toolbar, to the left of the Image Overlay tool. You can click on the appropriate button or select Add Path from the Add menu. You can make a straight line with two mouse clicks, one at each end of the line. While the Add Path (or Edit Path) pop-up window is open, the line vertices can be edited by clicking on them.
- Add a name for the path if you feel like it. Click OK in the Add Path window.
- Right click on the newly-created path in the Temporary Places list. Select "Show Elevation Profile" from the pop-up menu.
Assessment
Formative Assessment
Questions that could be used as part of a class discussion (e.g. as part of a think-pair-share exercise) or a homework exercise, to provide a formative assessment of, and/or encourage reflection upon, the material covered in the presentation. These are further described in Part 2 above.
Questions for discussion or formative assessment (Microsoft Word 2007 (.docx) 291kB Nov28 15)
Model answers to the discussion questions.
References and Resources
- Eyidoǧan, H. and A. Barka, The 1 October 1995 Dinar earthquake, SW Turkey, Terra Motae, 8, 5, 479–485.
- T.J. Wright, B.E. Parsons, J.A. Jackson, M. Haynes, E.J. Fielding, P.C. England, and P.J. Clarke, 1999, Source parameters of the 1 October 1995 Dinar (Turkey) earthquake from SAR interferometry and seismic bodywave modelling. Earth and Planetary Science Letters, 172, 1-2, 23–37.
Additional Resources for Instructors:
- This two-page article could be used as a short background reading for the students: "InSAR, a tool for measuring Earth's surface deformation," by M.E. Pritchard, Physics Today, July 2006, pg. 68-69


