Calculating Uncertainty in the Earth Sciences
This module is undergoing classroom implementation with the Math Your Earth Science Majors Need project. The module is available for public use, but it will likely be revised after classroom testing.
An Introduction to Uncertainty
In your everyday life, you might say you are uncertain of something when you are unsure or don't know an answer. In the Earth sciences, and in all sciences, the term uncertainty has a specific meaning. Here, uncertainty refers to the precision with which a number is known. Uncertainty can be represented as a plus or minus after a number, lines extending from a point or column on a graph, or as a band around a line on a graph. Sometimes uncertainty and error are used interchangeably, and error in a measurement can lead to uncertainty, but uncertainty may occur even when there are no measurement errors.
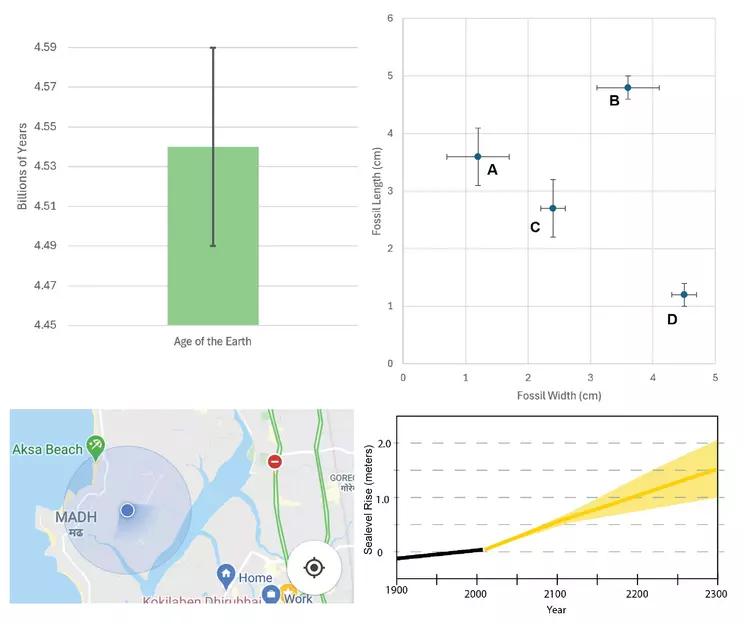
Upper-left - This column graph shows the age of the earth with uncertainty. The column extends to the best estimate of the Earth's age (4.54 billion years)). The lines extending above and below the column are the length of the uncertainty value (0.05 billion years) and together encompass the entire range from 4.49 to 4.59 billion years. Upper-right - Scatter plot of fossil dimensions. Uncertainty of fossil width is indicated by the horizontal lines extending from the data point, uncertainty in fossil length is indicated by vertical lines extending from the data point. Fossils A and B have relatively more uncertainty in their fossil width compared to C and D. Fossil A and C have relatively more uncertainty in their fossil length compared to fossil B and D. Lower-left - Uncertainty of location on a map. The blue dot represents the best estimation of location and the pale blue circle represents the uncertainty of the location. If the true location is not exactly at the blue dot, it will fall somewhere within the pale blue circle. Lower-right - This line graph shows the predicted sea level rise (RCP 4.5 scenario), the orange line is the best guess of sea level rise in this scenario, while the light orange band shows the uncertainty. Notice how uncertainty increases into the future. At 2300, the best guess of sea level rise is 1.5 meters, but true sea level rise will fall in the range of 1.0 to 2.0 meters. (source: https://en.wikipedia.org/wiki/Sea_level_rise#/media/File:1900-2300_Long-term_projections_of_sea_level_rise.svg)
![[creative commons]](/images/creativecommons_16.png)
Provenance: Graham Baird created upper left and upper right, Lisa Gilbert provided lower left, lower right is redrafted from https://en.wikipedia.org/wiki/Sea_level_rise#/media/File:1900-2300_Long-term_projections_of_sea_level_rise.svg
Reuse: This item is offered under a Creative Commons Attribution-NonCommercial-ShareAlike license http://creativecommons.org/licenses/by-nc-sa/3.0/ You may reuse this item for non-commercial purposes as long as you provide attribution and offer any derivative works under a similar license.
Why Do We Need Uncertainty?
Most numbers Earth scientists report aren't known with 100% certainty. An example is the age of the Earth. You may have heard it reported as 4.5 or 4.6 billion years. A more precise estimate is 4.54 ± 0.05 billion years (Wikipedia). Notice the ± symbol, which means "plus or minus." That symbol precedes the uncertainty value, which is 0.05 billion years. In other words, the best estimate for the age of the Earth is 4.54 billion years. It may not be exactly this age, but its age likely lies within the range of 4.49 to 4.59 billion years. Uncertainty, therefore, provides a range within which the true value likely falls.
Uncertainty can also be displayed graphically. For example, in a column graph or a scatter plot.
Earth scientists often use maps with locations, which can have uncertainty as well. Location is easily obtained with a smartphone, but they are typically accurate only to within a 5 m (16 ft) or ±5 m radius.
Uncertainty is also inherent in making forecasts into the future, such as a hurricane path three or five days into the future, the El Nino Southern Oscillation phase next season, or sea-level rise fifty years from now.
What Causes Uncertainty?
Uncertainty can result from a number of factors or processes. Uncertainty most commonly arises from difficulty in precisely measuring something or from variability in the thing being measured. For example, say you want to measure the average (mean) height of the maple trees in a park: each tree is a different height, and it is not possible to measure all the trees. There is uncertainty in the exact value of the average tree height because the average changes with each additional tree height measurement added to the data set. A second example is trying to precisely determine the wavelength of light from a laser. This obviously is a difficult task and repeated measurements don't produce the exact same result. These examples highlight that measurement of anything almost always has some uncertainty and is not an exact value.
When Don't I Need to Report Uncertainty?
Some numbers are precisely known and therefore do not require any calculation of uncertainty. Mount St. Helens erupted on May 18, 1980; we know that date because of eyewitnesses. All hydrogen atoms have exactly one proton; if an atom has a different number of protons, by definition we don't call it hydrogen. A centimeter is ten millimeters, again by definition. For numbers that have uncertainty, the uncertainty is not always determined or reported. This may be because the answer to a particular question does not change even if the uncertainty is considered. A detailed understanding of the question at hand can help guide whether uncertainty needs to be reported.
How Do I Calculate and Report Uncertainty?
Sometimes the amount of uncertainty is provided, other times uncertainty must be estimated, but most often the uncertainty must be calculated. The first step is to figure out which of those cases applies (provided, estimated, or calculated). Once you assess which situation applies, you can proceed through the proper steps accordingly.
Uncertainty Is Provided
Earth scientists use a variety of instruments to make measurements. Some are relatively simple, like a ruler. Others involve complex electronics and report values to many decimal places. The instructions that come with the instrument (or that can often be found online) have a list of specifications related to accuracy, precision, drift, and other factors.
Example 1 - Measuring mass
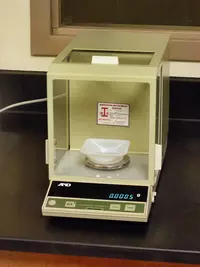
Digital scale for measuring mass
Provenance: David Harvey, CC BY-SA 4.0, via Wikimedia Commons. https://commons.wikimedia.org/wiki/File:Electronic_analytical_balance.png
Reuse: This item is offered under a Creative Commons Attribution-NonCommercial-ShareAlike license http://creativecommons.org/licenses/by-nc-sa/3.0/ You may reuse this item for non-commercial purposes as long as you provide attribution and offer any derivative works under a similar license.
You need a precise measurement of a soil sample. The manufacturer has extensively tested the scale and reports that the uncertainty of any measurement is 1%. The scale reports that the soil sample has a mass of 124 g. Provide the measurement with the uncertainty value as grams and provide the uncertainty range.
- Step 1. Decide if the uncertainty is provided, must be estimated, or needs to be calculated.
In this case, the uncertainty has been provided as 1%, which can also be written as a decimal 0.01.
- Step 2. Determine the uncertainty value for the reported measurement.
Multiply the sample mass by the percent in the decimal representation of the percent uncertainty: 124 x 0.01 = 1.24 g is the uncertainty value.
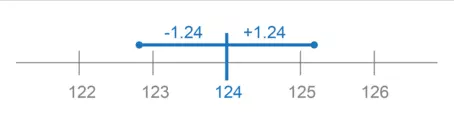
- Step 3. Report the measurement with the uncertainty value.
Provenance: Ann Mariam Thomas, Northwestern University
Reuse: This item is offered under a Creative Commons Attribution-NonCommercial-ShareAlike license http://creativecommons.org/licenses/by-nc-sa/3.0/ You may reuse this item for non-commercial purposes as long as you provide attribution and offer any derivative works under a similar license.
The measurement will be reported, followed by ± and the uncertainty value: 124 ± 1.24 g
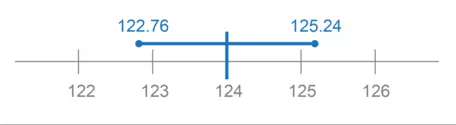
- Step 4. Report the measurement as a range.
Provenance: Ann Mariam Thomas, Northwestern University
Reuse: This item is offered under a Creative Commons Attribution-NonCommercial-ShareAlike license http://creativecommons.org/licenses/by-nc-sa/3.0/ You may reuse this item for non-commercial purposes as long as you provide attribution and offer any derivative works under a similar license.
Both add and subtract the uncertainty value to the measurement to define the lower and upper bounds of the range, then report the range: 124 - 1.24 = 122.76 g; 124 + 1.24 = 125.24 g. The range could be reported either as 122.76 to 125.24 g. or as 122.76-125.24 g.
Uncertainty Must Be Estimated
If the uncertainty of a measuring device is unknown, it can be reasonably estimated when the measurement is taken. The rule of thumb is that the uncertainty of a measuring device is 1/2 of its minimum gradation.
Example 2 - Measuring length
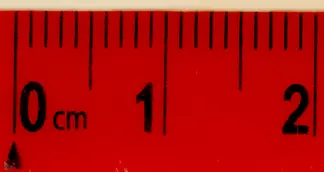
Most standard rules have millimeters as their smallest gradation.
Provenance: Graham Baird, University of Northern Colorado
Reuse: This item is offered under a Creative Commons Attribution-NonCommercial-ShareAlike license http://creativecommons.org/licenses/by-nc-sa/3.0/ You may reuse this item for non-commercial purposes as long as you provide attribution and offer any derivative works under a similar license.
You want a diameter measurement of a particularly large hailstone. Using a standard ruler, report the measurement with the uncertainty value and as an uncertainty range.
- Step 1. Decide if the uncertainty is provided, must be estimated, or needs to be calculated.
In this case, the uncertainty in your ruler must be estimated.
- Step 2. Determine the finest gradation of your measurement and then divide in half.
Standard rulers have 1 mm as the minimum gradation. Therefore, the estimated uncertainty value is 0.5 mm or 0.05 cm.
- Step 3. Take a measurement. Then report the measurement with the uncertainty value.
Provenance: Ann Mariam Thomas, Northwestern University
Reuse: This item is offered under a Creative Commons Attribution-NonCommercial-ShareAlike license http://creativecommons.org/licenses/by-nc-sa/3.0/ You may reuse this item for non-commercial purposes as long as you provide attribution and offer any derivative works under a similar license.
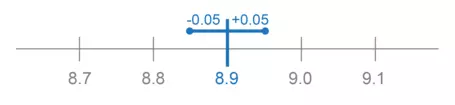
The diameter of the hail stone is 8.9 cm. The measurement will be reported, followed by ± and the uncertainty value: 8.9 ± 0.05 cm
- Step 4. Report the measurement as a range.
Provenance: Ann Mariam Thomas, Northwestern University
Reuse: This item is offered under a Creative Commons Attribution-NonCommercial-ShareAlike license http://creativecommons.org/licenses/by-nc-sa/3.0/ You may reuse this item for non-commercial purposes as long as you provide attribution and offer any derivative works under a similar license.
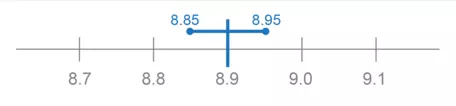
Both subtract and add the uncertainty value to the measurement to define the lower and upper bounds of the range, then report the range: 8.9 - 0.05 = 8.85 cm; 8.9 + 0.05 = 8.95 cm. The range could be reported either as 8.85 to 8.95 cm or as 8.85–8.95 cm.
Uncertainty Must Be Calculated
If you have a data set, you will most likely need to calculate the uncertainty. If you needed to determine the sizes of boulders in a river bed, the thickness of chilled margins on igneous intrusions, isotopic signatures of microfossils, etc., or just about any number in the Earth sciences, you would most likely repeatedly measure what it is you are investigating. In most situations, the result will be a table of numbers, where each measurement is somewhat different. What do you do next? The steps below are for data with a normal distribution. Most Earth sciences data has a normal distribution.
Example 3 - Calculating uncertainty on a radiometric date
You have a data set of lab results of ages (Comma Separated Values 306bytes Jun4 24) from a collection of zircon crystals. How would you report the mean age in millions of years ago (Ma) of the zircon with a 95% confidence interval?
- Step 1. Decide if the uncertainty is provided, must be estimated, or needs to be calculated.
In this case, the uncertainty must be calculated.
- Step 2. Get the data into a spreadsheet.
Either:
- download the lab results of ages (Comma Separated Values 306bytes Jun4 24) and open from a spreadsheet application such as Google Sheets or Excel, OR
- copy and paste the data from this page into a blank spreadsheet such as Google Sheets or Excel.
GB36_data_clean.csv| Analysis Number | Calcuated Age (Ma) |
|---|
| 1 | 1410 |
|---|
| 2 | 1448 |
|---|
| 3 | 1495 |
|---|
| 4 | 1446 |
|---|
| 5 | 1503 |
|---|
| 6 | 1497 |
|---|
| 7 | 1452 |
|---|
| 8 | 1427 |
|---|
| 9 | 1471 |
|---|
| 10 | 1422 |
|---|
| 11 | 1419 |
|---|
| 12 | 1425 |
|---|
| 13 | 1403 |
|---|
| 14 | 1435 |
|---|
| 15 | 1420 |
|---|
| 16 | 1461 |
|---|
| 17 | 1450 |
|---|
| 18 | 1460 |
|---|
| 19 | 1460 |
|---|
| 20 | 1417 |
|---|
| 21 | 1438 |
|---|
| 22 | 1445 |
|---|
| 23 | 1428 |
|---|
| 24 | 1459 |
|---|
| 25 | 1502 |
|---|
| 26 | 1451 |
|---|
| 27 | 1438 |
|---|
| 28 | 1434 |
|---|
| 29 | 1469 |
|---|
| 30 | 1462 |
|---|
| 31 | 1484 |
|---|
Download data (306bytes)
(last updated 2024-06-04 12:18:55)
- Step 3. Use the spreadsheet functions average, stdev, and count to determine mean, standard deviation, and number.
- `barx`, the mean is calculated using a spreadsheet by entering "=average(B2:B32)" into a cell. B2:B32 indicates the cells on the spreadsheet that contains the data. The result should be:
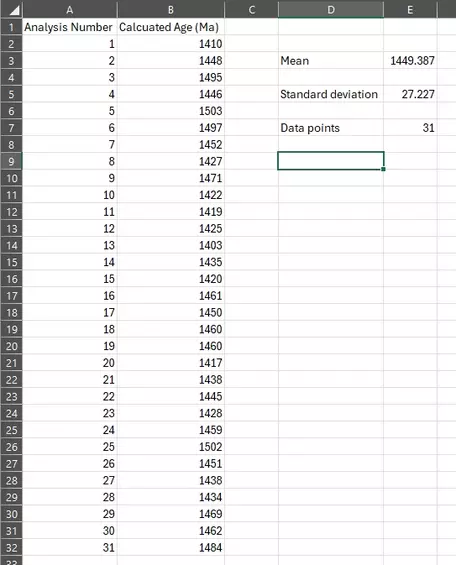
The spreadsheet after the data has been entered and the initials calculations made.
Provenance: Graham Baird, University of Northern Colorado
Reuse: This item is offered under a Creative Commons Attribution-NonCommercial-ShareAlike license http://creativecommons.org/licenses/by-nc-sa/3.0/ You may reuse this item for non-commercial purposes as long as you provide attribution and offer any derivative works under a similar license.
- `barx`, the mean, is 1449.387 Ma
- The standard deviation is calculated using a spreadsheet by entering "=stdev(B2:B32)" into a cell. B2:B32 indicates the cells on the spreadsheet that contains the data. The result should be:
- s, the standard deviation, is 27.227 Ma
- The number of data points is calculated using a spreadsheet by entering "=count(B2:B32)" into a cell. B2:B32 indicates the cells on the spreadsheet that contains the data. The result should be:
- Note: Remember that it is best to label what value a cell contains either directly above or to the left of the cell with a value.
- Step 4. Plug values for mean, standard deviation, and n into the following expression, which is known as the 95% confidence interval:
- `barx+-1.96*(s/sqrt(n))`
-
-
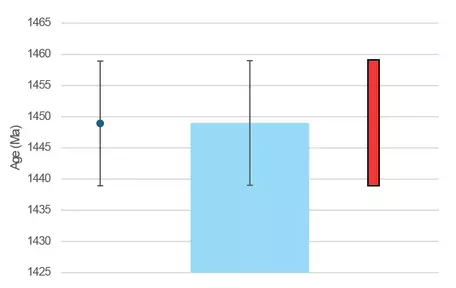
Three ways the confidence interval may be shown graphically. On the left is a point representing the average with lines extending from the point equal in length to the uncertainty value. In the middle is a bar chart with with lines extending from the bar top equal in length to the uncertainty value. On the right is a bar that covers the entire confidence interval range, note that here the average is not indicated.
Provenance: Graham Baird, University of Northern Colorado
Reuse: This item is offered under a Creative Commons Attribution-NonCommercial-ShareAlike license http://creativecommons.org/licenses/by-nc-sa/3.0/ You may reuse this item for non-commercial purposes as long as you provide attribution and offer any derivative works under a similar license.
Entering values found in Step 2, `1449+-1.96*(27.2/sqrt(31))`
- The value with uncertainty is 1449 ± 10 Ma, which is the crystallization age of the rock with 95% confidence.
- The value with uncertainty may be presented graphically in a variety of ways. Three examples are shown.
- Note: Remember to round to the correct significant figures and include units.
What Is a Normal Distribution? Why Multiply by 1.96? and Why Divide by `sqrt(n)`?
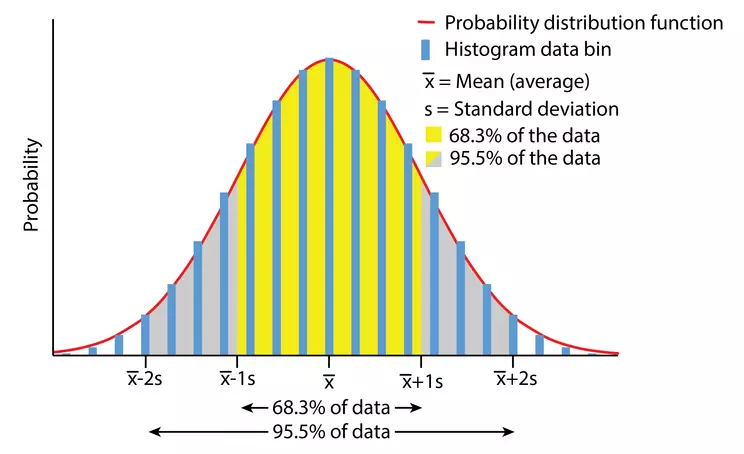
Data with a perfect normal distribution. The red line is the probability distribution function, while the blue bar chart shows the data binned into a histogram. The standard deviation is the average distance data is from the average and 1 standard deviation above and below the average is the inflection point on the normal distribution where the curve transitions from concave down to concave up.
Provenance: Graham Baird, University of Northern Colorado
Reuse: This item is offered under a Creative Commons Attribution-NonCommercial-ShareAlike license http://creativecommons.org/licenses/by-nc-sa/3.0/ You may reuse this item for non-commercial purposes as long as you provide attribution and offer any derivative works under a similar license.
If you look at the distribution of many large Earth science data sets, the distribution of the data follows a consistent pattern: most data points are close to the mean (average) of all the data (
`barx`), and data increasingly far from the mean are progressively more rare. This pattern is called a normal distribution, and in fact, it's called the normal distribution because data normally follows this pattern. Rounded to the nearest tenth, 68.3% of the data fall within ± 1 standard deviation from the mean, while 95.5% of the data fall within ± 2 standard deviations from the mean. Therefore, if a confidence interval is to capture 95% of the possible values, it will be slightly less than 2 standard deviations from the mean, hence the reason for multiplying by 1.96 in the confidence interval equation. Large data sets with many data points (large
`n`) are typically preferred because with more data points, the mean of the data set is more precisely known. Dividing the standard deviation (
`s`) by
`sqrt(n)` makes the confidence interval smaller and consistent with the size of the data set.
Where Do You Calculate Uncertainty in Earth Science?
Examples of where this math concept is used in different Earth science subdisciplines are many. Besides the examples above, they also include:
- Age estimates determined by any technique
- Grain size measurements in mineralogy or petrology
- Elemental or isotopic composition of rocks, minerals, or other material
- Location uncertainty for earthquake foci and epicenters
Next steps
I am ready to PRACTICE!
If you think you have a handle on the steps above, click on this bar to try practice problems with worked answers.
Or, if you want even more practice, see 'More help' below.More help (resources for students)
Pages written by Graham Baird (University of Northern Colorado) and Lisa Gilbert (Cabrillo College).
 An Introduction to Uncertainty