How Do I Use Mean, Median, Mode, and Standard Deviation?
Introduction to Descriptive Statistics in the Earth Sciences

![[creative commons]](/images/creativecommons_16.png)
Provenance: Sonia Nagorski, University of Alaska Southeast
Reuse: This item is offered under a Creative Commons Attribution-NonCommercial-ShareAlike license http://creativecommons.org/licenses/by-nc-sa/3.0/ You may reuse this item for non-commercial purposes as long as you provide attribution and offer any derivative works under a similar license.
An Introduction to Calculating Mean, Median, Mode, and Standard Deviation
Geoscientists collect tremendous amounts of data to describe, measure, and monitor the natural environment. It is necessary to summarize values rather than awkwardly listing long strings of data. For example, if you are planning a river rafting trip to investigate sandbars, you would look up the typical river flow near the sandbars of interest for a certain week instead of looking at a huge list of the flow levels measured every fifteen minutes all year long. Summary data are also needed to compare datasets to each other; for example, the number of landslides on rainy days versus the number of landslides on dry days. All such data are dependent on multiple measures that need to be summarized. This summary data is called descriptive statistics.
What Are Mean, Median, Mode, and Standard Deviation?
There are several commonly used parameters to describe data that are the backbone of descriptive statistics. In general, we are interested in defining something about the "center" of the data and also how spread out it is.
The central tendency or "measure of center" are:
- Mean is the average of the values in a numerical dataset. You may also see it written as `barx`.
- Median is the midpoint of the values in a numerical dataset. Half of the values in the data set will fall below the median, half will be above it.
- Mode is the most commonly occurring value in the dataset. If all values are unique, there is no mode. There can be multiple modes in a dataset (a.k.a "bimodal"). Mode is the only one of the three that can be used for numerical or categorical data.
There are also several ways to describe the variability of the data or "measure of spread." Here we will primarily work with:
- Standard deviation(s) describes how much variation there is around the mean (not the median or mode). A low standard deviation means the data are mostly close to the mean, while a high standard deviation means the data are spread out. Note that the s is not the same as the full range (minimum to maximum) of the data.
Other descriptive statistics terms you might run into:
Minimum - lowest value in a data set
Maximum - highest value in a data set
Range - difference between the minimum and maximum
Data set size is often referred to as "n" - "We measured the stream width in 15 places, so n=15 for our study."
How Do I Calculate Mean, Median, Mode, and Standard Deviation?
Here are steps to take to calculate the mean, median, mode, and standard deviation. For these calculations, we will use minimum January temperatures in Bozeman, Montana, for the years 2016–2020.

Provenance: Philip Downer Downloaded from Flickr under a CC BY-NC 2.0 usage agreement.
Reuse: This item is offered under a Creative Commons Attribution-NonCommercial-ShareAlike license http://creativecommons.org/licenses/by-nc-sa/3.0/ You may reuse this item for non-commercial purposes as long as you provide attribution and offer any derivative works under a similar license.
| Year |
Min. Jan. Temp. (°F) |
| 2020 |
21.6 |
| 2019 |
15.0 |
| 2018 |
18.8 |
| 2017 |
6.5 |
| 2016 |
16.4 |
Part 1: Calculate mean:
To calculate the mean, add all the data points together and divide the total by the number of data points.
Step 1. Add all the values together (in this example, temperature values).
`21.6 + 15.0 + 18.8 + 6.5 + 16.4 = 78.3`
Step 2. Divide the sum by the number of data points.
There are 5 data points so you divide `78.3` by `5`. `78.3/5=15.66`
Step 3. Round (if necessary) and report the result, including the correct units.

Provenance: Beth Pratt-Sitaula, EarthScope Consortium
Reuse: This item is offered under a Creative Commons Attribution-NonCommercial-ShareAlike license http://creativecommons.org/licenses/by-nc-sa/3.0/ You may reuse this item for non-commercial purposes as long as you provide attribution and offer any derivative works under a similar license.
The answer above has more decimal places than the original values, so many instructors will want you to round to the tenths, which would be 15.7. So the mean minimum temperature in January in Bozeman is 15.7° F.
How to use Excel/Sheets to calculate the mean minimum January temperature
To calculate the mean in Google Sheets or in Excel, click on an empty cell and type:
=AVERAGE( )
then, move your cursor inside the parentheses. Highlight all the cells with the temperature data, and then hit return. The mean will appear in the cell. For example, the formula might end up looking like =AVERAGE(B2:B6)
Part 2: Calculate standard deviation
Calculating standard deviation by hand is more difficult than calculating the mean, median, or mode. It is often more efficient to calculate this statistic using Excel or Google Sheets, but it is important to understand the math behind calculating standard deviation. At its heart, it involves taking the difference between each numerical data value and the mean.
standard deviation `= sqrt(((value1-mean)^2+(value2-mean)^2+(value3-mean)^2+etc)/(n - 1)`
Step 1: Determine the mean of the data values.
This was done above. Mean temperature = 15.7°F
Step 2: Calculate the square of the difference from the mean for each data value.

Provenance: Beth Pratt-Sitaula, EarthScope Consortium
Reuse: This item is offered under a Creative Commons Attribution-NonCommercial-ShareAlike license http://creativecommons.org/licenses/by-nc-sa/3.0/ You may reuse this item for non-commercial purposes as long as you provide attribution and offer any derivative works under a similar license.
Take each data value, subtract the mean value, and then square it.
`(value-mean)^2`. You can make a table of the data and the squared differences from the mean, or you can list them.
Squared differences from the mean are:
- `(16.4 – 15.7)^2=0.49`
- `(6.4 – 15.7)^2 = 86.49`
- `(18.8 – 15.7)^2 = 9.61`
- `(15 – 15.7)^2 = 0.49`
- `(21.6 – 15.7)^2 = 34.81`
Step 3: Add all the squared differences obtained in Step 2.
`0.49+86.49+9.61+0.49+34.81=131.89`
Step 4: Divide the sum of the squared differences (from Step 3) by the number of data points minus 1.
`131.89/(5-1)=131.89/4=32.9725`
Step 5: Take the square root of the result you obtained in Step 4.
`sqrt(32.9725)=5.74217`°F
Step 6: Round (if necessary) and report the result, including the original units.
Since the original data went to the tenths of a degree, we round
`5.74217°F` to `5.7°F` to get the final standard deviation value.
That is ... most of the data falls within 5.7°F of the mean value of 15.7°F.

Provenance: Beth Pratt-Sitaula, EarthScope Consortium
Reuse: This item is offered under a Creative Commons Attribution-NonCommercial-ShareAlike license http://creativecommons.org/licenses/by-nc-sa/3.0/ You may reuse this item for non-commercial purposes as long as you provide attribution and offer any derivative works under a similar license.
How to use Excel/Sheets to calculate the standard deviation of the temperature data
Click on an empty cell, and type:
=STDEV( )
Then, move your cursor inside the parentheses. Using your mouse or touchpad, highlight all the cells with the temperature data, and then hit return. The standard deviation will appear in the empty cell.
Standard deviation of a sample vs. a population
There are actually two ways to calculate a standard deviation.
- Standard deviation of a sample - is used when you don't have all the data that you might have. This is typically what is used in Earth science classes and what we will use throughout this module.
- Standard deviation of a population - is used if you have a complete set of data. For instance, the height of every single student in a class, then you would use the standard deviation of a population, which will be slightly less.
In spreadsheets, these two standard deviations are calculated by the =STDEV.S() and the =STDEV.P() functions. If you just use =STDEV() you will get the sample standard deviation.
Part 3: Calculate median:
To calculate the median, put the numerical data values in order from smallest to greatest. If there is an odd number of data points, find the value located in the middle of the data points. If there is an even number of data points, take the mean (average) of the two middle data points.
Step 1: Order the values from lowest to highest.
`6.5°, 15.0°, 16.4°, 18.8°, 21.6°`
Step 2: Find the value in the center of the ordered values.

Provenance: Beth Pratt-Sitaula, EarthScope Consortium
Reuse: This item is offered under a Creative Commons Attribution-NonCommercial-ShareAlike license http://creativecommons.org/licenses/by-nc-sa/3.0/ You may reuse this item for non-commercial purposes as long as you provide attribution and offer any derivative works under a similar license.
Here, there are 5 temperature measurements. Because 5 is an odd number, the median is the middle value. Here, that is
`16.4°`F.
If there were an even number of temperature measurements (for example, if there were 6 measurements), we would take the two center measurements (data points 3 and 4) and average those.
How to use Excel/Sheets to calculate the median of the temperature data
To calculate the median in Google Sheets or in Excel, click on an empty cell and type:
=MEDIAN( )
Then, move your cursor inside the parentheses. Using your mouse or touchpad, highlight all the cells with the temperature data, and then hit return. The median will appear in the empty cell.
Part 4: Calculate mode:
To find the mode, put your data points in order from smallest to largest and identify the value that appears most commonly. This is the mode. It is possible that there is no mode (if all values are unique). There may also be multiple modes if there are many repeats in the data, so make sure to look carefully at the ordered data. If your data are not numerical but categorical (e.g., soil type, atmospheric pollutant type, sand dune type), provide a numeric value (e.g. 1–5) for each type, and calculate the mode according to the instructions above.
Step 1: Order the values from lowest to highest.
`6.5°, 15.0°, 16.4°, 18.8°, 21.6°`
Step 2: Find the value that occurs the most often.
Look for the value that occurs the most often. Here, all the temperatures are different, so there is no mode.
How to use Excel/Sheets or calculator to calculate the mode of the temperature data
Click on an empty cell, type:
=MODE( )
Then, move your cursor inside the parentheses. Using your mouse or touchpad, highlight all the cells with the temperature data, and then hit return. The mode will appear in the empty cell.
When Do I Use Mean, Median, Mode, and Standard Deviation?
Mean
The most commonly used measure of the center (or average) of a data set. Most people know it as an "average." It is most useful when you do not have large outliers, which are values that are very far from the mean.
- Mean density of a mineral based on 30 samples of it
- Mean rate of plate motion based on multiple measured and dated segments of the plate's oceanic crust
- Mean amount of rainfall each year in a particular climate based on hourly or daily data
- Mean monthly concentrations of carbon dioxide and sulfur dioxide being emitted from volcanic vents based on hourly measurements
Median
Commonly used for datasets that are not normally distributed (that is, they have large outliers). The median is not as strongly influenced by particularly large or small values in the dataset. It can be helpful to look at the distribution (shape) of the data to check if it is normally distributed or if there are outliers. To learn about distributions and practice working with histograms, see How Do I Interpret and Create Histograms.
-

The measured snow depths show one significant outlier of more than 3 meters while the others all cluster around the median of 0.56. This outlier, perhaps due to local topography, brings the average to nearly 1 meter. This is case where the median is more representative of the typical snow depth.
Provenance: Beth Pratt-Sitaula, EarthScope Consortium
Reuse: This item is offered under a Creative Commons Attribution-NonCommercial-ShareAlike license http://creativecommons.org/licenses/by-nc-sa/3.0/ You may reuse this item for non-commercial purposes as long as you provide attribution and offer any derivative works under a similar license.
Median annual streamflow in a river (which may have abnormally high or low flows for short periods of time)
- Median snow depth data (which can produce large outliers from unusual underlying topography)
- Median concentrations of trace metals in streams (which are very expensive to analyze, and so datasets are typically small)
- Median sizes of atoll islands in the Pacific Ocean (there are many more small ones than large ones)
- Median grain size distribution of sediment samples from a lakebed (typically, grains are well sorted in lacustrine and fluvial systems but contain outliers)
Mode
Used when you need the most common value(s) in the dataset. The mode is particularly appropriate when there are a lot of repeated values in a dataset, such as when there is a binary (yes/no, present/absent, high/low, or 0/1 type of response), or when the data are not numerical but categorical. If the data are categorical, it may help to code the category types with a numerical value (for example, yes = 1 and no = 0).
-

Provenance: Beth Pratt-Sitaula, EarthScope Consortium
Reuse: This item is offered under a Creative Commons Attribution-NonCommercial-ShareAlike license http://creativecommons.org/licenses/by-nc-sa/3.0/ You may reuse this item for non-commercial purposes as long as you provide attribution and offer any derivative works under a similar license.
Most common hurricane category level (1–5) at landfall in the United States
- Most common soil texture in a given field area (sand, loamy sand, sandy loam, sandy clay loam, loam, silt loam, silt, silty clay loam, clay, clay loam, sandy clay, and silty clay)
- Drainage pattern (dendritic, trellis, radial, rectangular) that occurs most often on a given rock type.
- Most common river sediment by grain size (categorical: clay, silt, sand, gravel, etc. OR numerical: 0.00098–0.0039 mm, 0.0039–0.0625 mm, 0.0625-2 mm, 2-64 mm, etc.)
- Most common landslide type within a region (translational slide, rotational slide, debris flow, rockfall, mudflow . . .)
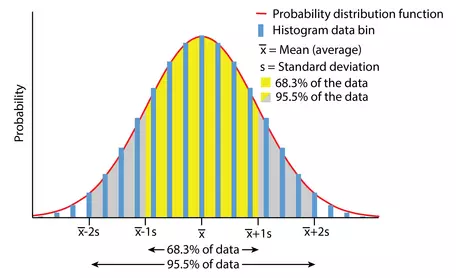
Data with a perfect normal distribution. The red line is the probability distribution function, while the blue bar chart shows the data binned into a histogram. The standard deviation is the average distance data is from the average and 1 standard deviation above and below the average is the inflection point on the normal distribution where the curve transitions from concave down to concave up.
Provenance: Graham Baird, University of Northern Colorado
Reuse: This item is offered under a Creative Commons Attribution-NonCommercial-ShareAlike license http://creativecommons.org/licenses/by-nc-sa/3.0/ You may reuse this item for non-commercial purposes as long as you provide attribution and offer any derivative works under a similar license.
Standard deviation
Can be used with the mean of a data set. It is a measure of how large the variability is around the single mean value. In a perfectly normal distribution (a "bell curve"), 68.3% of the values will be within 1 standard deviation on either side of the mean. It is not the full range (minimum to maximum) of data. When a median is reported, a different measure of variability, such as the Interquartile Range, is appropriate.
Example problem: Summarizing ocean depth data
Ocean depth is needed to calculate the speed at which a tsunami travels across the ocean. The speed of a tsunami is greater when the water is deeper. In this problem, you will work toward finding the depth value.
Problem: A megathrust M 9.1 earthquake strikes off of Kodiak, Alaska, and causes a massive displacement of water, generating a tsunami. To calculate the arrival time of a tsunami in Hilo, Hawaii, which is 4090 km away, one first needs to know the speed that the tsunami is traveling across the ocean, and that is dependent on the mean depth of the ocean.
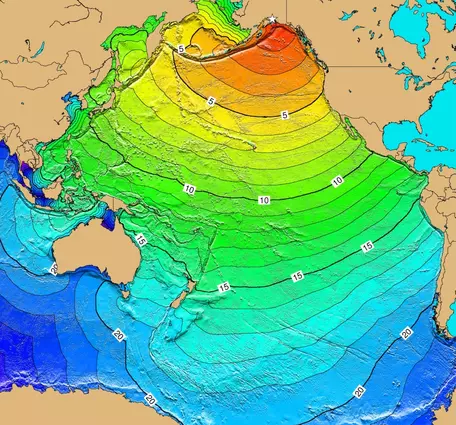
This shows the tsunami arrival times (in hour) in the Pacific Ocean from a destructive tsunami generated by the 1964 Great Alaska Earthquake near Anchorage (~650km away from the tsunami in the problem presented here). Numbers represent tsunami travel arrival times (in hours). Source: https://www.ncei.noaa.gov/products/natural-hazards/tsunamis-earthquakes-volcanoes/tsunamis/travel-time-maps
![[reuse info]](/images/information_16.png)
Provenance: NCEI, the World Data Service for Geophysics (including Tsunamis), and the UNESCO-IOC International Tsunami Information Center https://www.ncei.noaa.gov/products/natural-hazards/tsunamis-earthquakes-volcanoes/tsunamis/travel-time-maps
Reuse: This item is in the public domain and maybe reused freely without restriction.
From Google Earth, you can obtain values of ocean depth between Kodiak and Hilo. Marking 20 evenly spaced values of ocean depth between the two locations, you find the following depths:
-4531m, -4607m, -4927m, -5051m, -5286m, -5276m, -4899m, -5609m, -5475m, -5255m, -5582m, -5564m, -5407m, -5525m, -5444m, -5525m, -5630m, -4662m, -4992m, and -1879m
| Ocean depth (m) |
| -4531 |
| -4607 |
| -4927 |
| -5051 |
| -5286 |
| -5276 |
| -4899 |
| -5609 |
| -5475 |
| -5255 |
| -5582 |
| -5564 |
| -5407 |
| -5525 |
| -5444 |
| -5525 |
| -5630 |
| -4662 |
| -4992 |
| -1879 |
a) Find the mean, standard deviation, median, and mode of the water depth measurements.
Part 1: Calculate the mean depth. The mean depth of the ocean between Kodiak and Hilo is a key value to know when to expect a tsunami to strike the Hawaiian island.
Step 1. Add all the values together (in this example, depth values).
-4531 + -4531 + -4607 + -4927 + -5051 + -5286 + -5276 + -4899 + -5609 + -5475 + -5255 + -5582 + -5564 + -5407 + -5525 + -5444 + -5525 + -5630 + -4662 + -4992 + -1879) = -101126 m
Step 2: Divide by the number of data points.
There are 20 measurements, so divide -101126 by 20.
`-101126/20 = -5056.3` m
Step 3: Round (if necessary) and report the result, including the correct units.
Because the original set of values was only measured to the closest meter, you will round to the closest meter. So -5056.3 m rounds to -5056 m (be sure to include the units!)
To do this in Google Sheets and Microsoft Excel: make a column with the list of depths. In a new cell, type: "=AVERAGE( )". Within the parentheses, highlight the list of depth values, and hit return. The average (mean) value will be produced.
Part 2: Calculate the standard deviation of the ocean depth data. This is seldom done by hand, as it is simpler and avoids errors to use the "=STDEV( )" formula in Sheets or Excel, but the manual method is shown here.
Step 1. Determine the mean of the data values.
This was done above. Mean depth = -5056 m
Step 2: Calculate the square of the difference from the mean.
Take each data value, subtract the mean value (-5056 m), and then square the result.
`(value-mean)^2`
(Note that in this example you are subtracting a negative number, which is the same as adding it).
Here a table is easier to use than a list, since there are 20 data points. Make a table of the values, differences from the mean value, and the square of the differences from the mean:
| Ocean depth (m) |
Difference from the mean (-5056 m) |
Square of difference from the mean |
| -4531 |
525 |
275625 |
| -4607 |
449 |
201601 |
| -4927 |
129 |
16641 |
| -5051 |
5 |
25 |
| -5286 |
-230 |
52900 |
| -5276 |
-220 |
48400 |
| -4899 |
157 |
24649 |
| -5609 |
-553 |
305809 |
| -5475 |
-419 |
175561 |
| -5255 |
-199 |
39601 |
| -5582 |
-526 |
276676 |
| -5564 |
-508 |
258064 |
| -5407 |
-351 |
123201 |
| -5525 |
-469 |
219961 |
| -5444 |
-388 |
150544 |
| -5525 |
-469 |
219961 |
| -5630 |
-574 |
329476 |
| -4662 |
394 |
155236 |
| -4992 |
64 |
4096 |
| -1879 |
3177 |
10093329 |
Step 3: Add all the squared differences obtained in Step 2.
275625 + 201601 + 16641 + 25 + 52900 + 48400 + 24649 + 305809 + 175561 + 39601 + 276676 + 258064 + 123201 + 219961 + 150544 + 219961 + 329476 + 155236 + 4096 + 10093329 = 12,971,356
Step 4: Divide the sum of the squared differences from (Step 3) by the number of data points minus 1.
`12971356/(20-1)=12971356/19=682702.9`
Step 5: Take the square root of the value you obtained in Step 4.
`sqrt(682702.9) = 826.26`
Step 6: Round (if necessary) and report the result, including the original units.
You found the value in Step 5 to be 826.26, but the original set of values was only measured to the meter, so round to the closest meter. s = 826 m.
Note: to calculate this in Google Sheets and Microsoft Excel: make a column with the list of depths. In a new cell, type: "=STDEV( )". Within the parentheses, highlight the list of depth values, and hit return. The standard deviation value will be produced.
Part 3: Calculate the median depth
Step 1. Order the values from lowest to highest.
-5630m, -5609m, -5582m, -5564m, -5525m, -5525m, -5475m, -5444m, -5407m, -5286m, -5276m, -5255m, -5051m, -4992m, -4927m, -4899m, -4662m, -4607m, -4531m, -1879m
Step 2. Find the value in the center of the ordered values.
Because there are an even number of values, you will need to take the average of the 2 middle values.
There are 20 values, so the middle is between values #10 (-5286 m) and #11(-5276 m). Take the average of those two values
`((-5286 + -5276)/2)` to get the median.
Median = -5281m.
Note: to calculate this in Google Sheets and Microsoft Excel: make a column with the list of depths. In a new cell, type: "=MEDIAN( )". Within the parentheses, highlight the list of depth values, and hit return. The median value will be produced.
Part 4: Calculate the mode of the depth data
Step 1: Put the data points in order from lowest to highest.
-5630m, -5609m, -5582m, -5564m, -5525m, -5525m, -5475m, -5444m, -5407m, -5286m, -5276m, -5255m, -5051m, -4992m, -4927m, -4899m, -4662m, -4607m, -4531m, -1879m
Step 2: Look for the value that occurs the most often.
In this dataset, there are 2 depths that are identical: (-5525m). All the other depths are unique. Thus, the mode is -5525m.
Note: to calculate this in Google Sheets and Microsoft Excel: make a column with the list of depths. In a new cell, type: "=MODE( )". Within the parentheses, highlight the list of depth values, and hit return. The mode value will be produced.
b) Compare the usefulness of mean, median, and mode in this case:
The formula for calculating the tsunami velocity uses the mean ocean depth, and so the mean is most useful here. However, the median would be useful if there were some strong outliers in the depth data (e.g., if the depth data happen to include the Aleutian trench, which is very narrow and deep or a very tall seamount; these features are unusual along the transect of the seafloor and might bias the mean). In this dataset, the mode, which included only 2 of the 20 values, is not particularly informative; it just says that the same depth happened to be measured twice. The standard deviation is quite small relative to the mean, signifying that the dataset has a fairly small amount of variability and the ocean depth is fairly uniform between Alaska and Hawaii.
c) How long will it take the tsunami to get to Hilo, Hawaii, from Kodiak, Alaska ?
Now that you know the mean ocean depth, you can calculate the speed at which the tsunami is traveling. The velocity of a tsunami is `V= sqrt(9.8 m/s^2 xx abs(D))` where `abs(D)` is the absolute value of the mean ocean depth.
Since the absolute value of the mean ocean depth is 5056 m (you calculated that above),
`V= sqrt(9.8 m/s^2 xx 5056 m) = 223` m/s, or 801 km/hr (see also lesson on unit conversions)
Knowing the speed and the distance, you can then calculate how long it will take the tsunami to arrive in Hilo: (using the formula, time = distance/velocity);
`time = (4090 km)/(801 (km)/(hr)) = 5.10` hrs
Where Do You Calculate Mean, Median, Mode, and Standard Deviation in Earth Science?
These calculations are used in virtually every area of Earth science, including
- Volcanology
- Oceanography
- Meteorology and atmospheric sciences
- Planetary geology
- Sedimentology
Next Steps
I am ready to PRACTICE!
If you think you have a handle on the steps above, click on this bar to try practice problems with worked answers.
Or, if you want even more practice, see 'More help' below.More Help
Pages written by Sonia Nagorski, University of Alaska Southeast, and Robyn Gotz, Montana State University.