For the Instructor
These student materials complement the Water Science and Society Instructor Materials. If you would like your students to have access to the student materials, we suggest you either point them at the Student Version which omits the framing pages with information designed for faculty (and this box). Or you can download these pages in several formats that you can include in your course website or local Learning Managment System. Learn more about using, modifying, and sharing InTeGrate teaching materials.Formative Assessment 2: Well Hydrograph Records
Instructions
Answer each question in 2-3 complete sentences. Consider each question carefully and be sure to provide a complete answer.
Questions
Use the graphs below to answer the questions that follow.

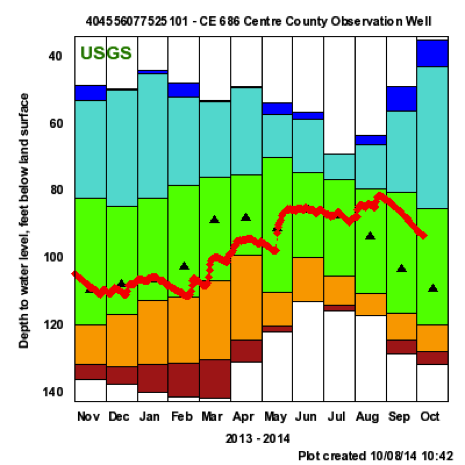
 Figures 31 and 31. Hydrographs for 2013-2014 for two monitoring wells: one near Sacramento, CA (top), and one in Centre County, PA near State College (bottom). The red diamonds show the water level (hydraulic head) measured in depth below the land surface. Black triangles show the historical mean, and colored bars show historical percentiles for water level (red= <10%; orange = 10-24%; green = 25-75%; light blue = 76-90%; dark blue = >90%). Note that the water level in the Sacramento example is near the all-time historical low, whereas in Centre County the water level is near the historical mean.
Source: USGS, 10/4/2014
 Figure 32. Long-term well hydrograph showing water levels from 1987 through 20114, for the same well as above (Figure 30) near Sacramento, CA.
Source: USGS, 10/4/2014
Questions:
- Examine the hydrographs above. Are the data consistent with what you know or remember about the news and/or climactic conditions in these two areas over the past year? How so?
- Examine Figure 32. Note the cycles of water level superimposed on the long term trend. What do you think causes these?
- The hydrograph illustrates an overall decline in water level of about 25 feet, with a brief period from ~1997-2003 when the trend is temporarily reversed. What do you think causes these two trends?
Files to Download
There is no worksheet for this assignment. It is a writing assignment.
Scoring and Rubric
Each answer will earn a maximum of 5 points, as described in the rubric below.
| Work Shown | Possible Points |
|---|---|
| Answer reflects careful consideration of the questions | 2 |
| Answer is appropriate in length | 1 |
| Answer is legible | 1 |
| Answer given in complete sentences; correct spelling and grammar | 1 |
Submitting your Answers
Bring your written answers to class. If they are hand-written, be sure your writing is legible. If your handwriting is not clear, please type and print your answers.