For the Instructor
These student materials complement the Coastal Processes, Hazards and Society Instructor Materials. If you would like your students to have access to the student materials, we suggest you either point them at the Student Version which omits the framing pages with information designed for faculty (and this box). Or you can download these pages in several formats that you can include in your course website or local Learning Managment System. Learn more about using, modifying, and sharing InTeGrate teaching materials.Step 4: Prep and Label Data
- First, let's label the dataset so you know what each column contains for data. Do this before you add data records from your other sites so you keep it organized and less complicated.
- We recommend that you insert a new row at the top of your data and provide labels similar to those shown in Figure 4.44.
- While you are at it, go ahead and make a new column and type in an equation in cell F2 to calculate the elevation relative to Mean Sea Level (MSL). This is easy. All you have to do is type in the equation "= B2 - 7000", where B2 is the reading for sea level you just downloaded. Copy this calculation for the rest of the values all the way down the page, as shown in Figure 4.44.
- Next, add a column for Date (Month, Year). In the screenshot (Figure 4.45), you will see that we added this to column E.
- In order to do this, you will have to manually type in the month, date, and year for the first 12 months so Excel understands the pattern we want repeated the rest of the way through the data.
- You will also need to tell Excel using the format cells tool that this column will be a date formatted column (select the entire column by clicking on column E). You can then bring this tool up by right clicking and hitting format cells, or you can use the menu bar at the top of the screen.
 Figure 4.43: First screenshot for Step 3. This is the first step in converting your pasted data from a single column of data into separate columns for each variable as described above.Credit: Microsoft Excel Screenshot
 Figure 4.44: Second screenshot for Step 3. This is the first step in converting your pasted data from a single column of data into separate columns for each variable as described above.Credit: Microsoft Excel Screenshot
 Figure 4.45: Third screenshot for Step 3. This is the first step in converting your pasted data from a single column of data into separate columns for each variable as described above. Screen clipping taken: 1/16/2014 8:49 AMCredit: Microsoft Excel Screenshot
- In the number menu, select "Date" as your "Category" and scroll down through the date "Type" until you find M-01. This simply tells Excel that your data is in month year format. Now, go ahead and type in the Month/Date/Year in E2.
- In Figure 4.45 above we typed: 1/15/1908 - since the 15th of January is the middle of the month, and because the sea-level value represents the month's average. The reasoning for this is explained in the PSMSL help guide on the website. Do this same thing for the first 12 months of your dataset. i.e., 2/15/1908, 3/15/1908, etc.
- Next, copy and paste the pattern the rest of the way through the dataset. Make sure you select the 12 months, and then drag downward. In our example, row 14 E shows "J-09", and row 15 E shows "F-09," so we know that we have done it correctly.
- At this point, it is important to "clean up" the data by handling any intervals that have incomplete or discrepant data. As you scroll down through your dataset, you may find some data that has a "-99999" value in column B. It is critical that you don't just delete the entire row (date of reading), but we need to ensure that any data that has lost its integrity for that month/year for whatever reason not be used to influence the rest of the data in an inaccurate or artificial way. Geoscientists have to make decisions about how to handle these data points. Sometimes, they will omit the data by treating the month as a blank, or sometimes they will average the values of the immediately preceding and following data points and use that value to fill the blank. This way the data point still holds its place, but its signal doesn't interfere with the rest of the data points in the dataset. This ensures continuity in data analysis methods (i.e., calculating running averages for instance). Ultimately, you should make a decision on how to handle these.
- In our dataset, we have decided to blank the data for now, but this will have repercussions for later on, so you may want to do something about filling the gap at this point. (i.e., averaging the two points...) For the example dataset (Figure 4.46), this could be done in a couple of ways:
- by entering a formula in B 880 to add the values from B 879 and B 881 and then divide them by 2, or
- by using the Average function within the formula menu. Either way, in our example, you would see "7020" as a result in box B 880.
- Whatever decision you make for handling discrepant data, make sure you are consistent in your methodology and apply that methodology to all instances in all of your datasets.
 Figure 4.46: Fourth screenshot for Step 3. Here you will notice â€99999 in column B (in cell B880), and as a result you see a â€106999 inthe elevation relative to MSL. This is clearly a bad data point that needs to be culled or replaced by a reasonable value thatwon't influence the rest of the dataset in an artificial way. This data point needs to be fixed before any quantitative analysisis performed. Screen clipping taken: 1/16/2014 9:14 AMCredit: Microsoft Excel Screenshot
- In our dataset, we have decided to blank the data for now, but this will have repercussions for later on, so you may want to do something about filling the gap at this point. (i.e., averaging the two points...) For the example dataset (Figure 4.46), this could be done in a couple of ways:
In Figure 4.47 below, we have simply removed the -99999 reading from B 880.
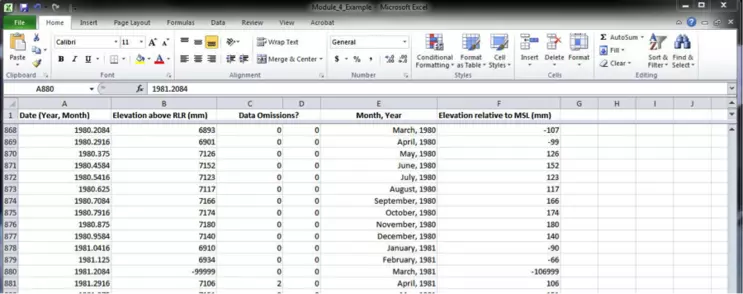 Figure 4.47: Culling the "incomplete data" from the dataset.
Credit: Microsoft Excel Screenshot
Once initial data cleaning has been completed, repeat the process for your other required dataset. We recommend you place all data into the Excel spreadsheet we provided, but you can use different sheets (see bottom left of the screen shot in part l, Figure 4.44 above).
- You can use Sheet1 for one site (named Panama_Data in the example), and then use Sheet2 for your second.
- Alternatively, you could put all the data in the same sheet, which has its advantages later on, but make sure you keep it organized.


