Brillouin Spectroscopy
by Sylvia-Monique Thomas, University of Nevada Las Vegas
Outline
Introduction
Mechanism
Applications
Instrumentation
Literature
Additional Literature
Problem Set
Related Links
Introduction
Brillouin scattering is named after Léon Nicolas Brillouin (1889-1969). The french physicist first predicted the inelastic scattering of light (photons) by thermally generated acoustic vibrations (phonons) in 1922. The soviet physicist Leonid Mandelstam (1879-1944) is believed to have discovered the scattering as early as 1918, but he published it only in 1926. Other commonly used names are Brillouin light scattering (BLS), Brillouin-Mandelstam scattering (BMS), and Brillouin-Mandelstam light scattering (BMLS).
Mechanism
In classical physics, Brillouin scattering can be described as reflection of the incident light from a three-dimensional diffraction grating produced by periodic density variations (refraction index changes) in a material due to propagating sound waves. Since the wave is traveling with the speed of sound, the scattered light frequency changes, too, it experiences a Doppler shift.
From a quantum physics perspective, Brillouin scattering is an interaction between an electromagnetic wave and a density wave (photon-phonon scattering). Thermal motions of atoms in a material (e.g., solid, liquid) create acoustic vibrations, which lead to density variations and scattering of the incident light. The scattering is inelastic, which means that the kinetic energy of the incident light is not conserved (as in the case of elastic scattering) but the photon either loses energy to create a phonon (Stokes, kS= kI+ q, ωS = ωI+ ωq), or gains energy by absorbing a phonon (Anti-Stokes, kS= kI- q, ωS = ωI-ωq). Q and ωq are the wave vector and frequency of the phonon, and kS, ωS, kI and ωI are the wave vectors and frequencies of the scattered and incident photon, with 107 Hz < ωq < 1012 Hz.
Inelastic scattering schematic.

The frequency and path of the scattered light differ from those of the incident light. The magnitude of the photon frequency shift (ωB, Brillouin shift) depends on the wave length of the incident light (λ0), the refractive index (n) of the sample, the angle θ between incident and scattered light, and the phase velocity of the acoustic wave; it is equal to the energy of the phonon and can be used to measure the latter by analyzing a characteristic Brillouin spectrum, where only modes lying close to the Brillouin zone center are investigated (Q=0).

What is the difference to Raman spectroscopy?
Raman scattering also describes the inelastic scattering interaction of light with vibrations of matter. However, while Brillouin scattering involves the scattering of photons from low-frequency phonons, in Raman spectroscopy photons are scattered by interaction with vibrational and rotational transitions in molecules, and the frequency shift and material information are very different. While Brillouin spectroscopy measures the elastic behavior of a sample using an interferometer, Raman spectroscopy determines the chemical composition and molecular structure of a material using either an interferometer or, e.g., a dispersive (grating) spectrometer.
Applications
Brillouin spectroscopy is the most frequently used technique for measurements of single-crystal elastic properties of materials of geophysical interest. Elastic properties describe the temporary reversible volume and shape changes that occur when stresses are applied to a mineral and thus allow the calculation of the seismic wave velocities (seismic properties of the Earth) and the change in density that occurs when minerals are under extreme conditions (pressure and/or temperature). Seismic velocities (VP, VS) are related to the density (ρ), bulk (K) and shear (µ) moduli of a material.

The first Brillouin measurements of geological importance were carried out by Don Weidner and colleagues in 1975 [ref. 14]. In combination with the diamond anvil cell, phases that are stable at high pressure and high temperature can be investigated. The first experiments at very high pressure were performed by Bill Bassett and Edward Brody in 1977 [ref. 15]. If in addition combined with synchrotron radiation sound velocities and a material's volume (density) can be studied simultaneously.
The relationship of acoustic velocity (ν), phonon wave vector (q) and phonon frequency (ωq) is given by:
ωq=νq .
Acoustic velocities are related to elastic moduli and density of the sample, ν2 = c / ρ.
Advantages of Brillouin spectroscopy
- optical, non-contact technique (no coupling of transducers or other devices to the sample are needed to produce an acoustic excitation)
- suitable for measurements on polycrystalline samples and on small transparent or translucent samples of less than 100 µm in size
- can be performed on samples at high pressure and/or high temperature in a diamond anvil cells
Disadvantages of Brillouin spectroscopy
- only transparent samples can be measured (scattering efficiency of opaque samples is very low)
- low-temperature measurements are not feasible (scattering intensity is very low due to a decreasing number of vibrations with decreasing temperature)
Instrumentation
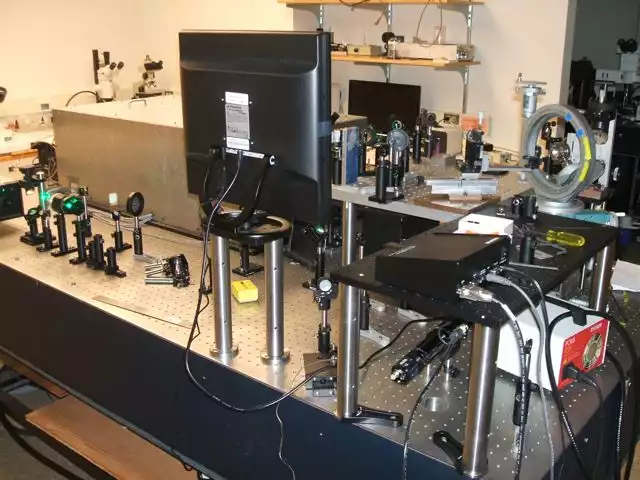
What does a Brillouin system look like?
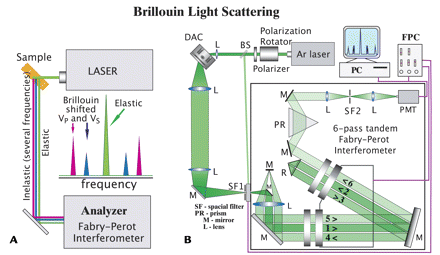
Interferometry is based on wave superposition. A Fabry-Pérot interferometer in particular is made of two parallel mirrors, where multiple light reflections between the two surfaces infer light wave interference. When two waves with the same frequency combine, the resulting pattern is determined by the phase difference between the two waves. Depending on the wavelength of the light, the angle the light travels between the reflecting surfaces, the thickness of the mirrors, and the refractive index of the material waves that are in phase will experience constructive interference (transmission peak maximum), while waves that are out of phase will experience destructive interference (transmission peak minimum). In an interferometer a single incident beam of coherent light is split into two beams by a grating or a partial mirror. The two beams will travel a different a path until they are recombined before arriving at a detector. The difference in the distance traveled by each beam creates a phase difference between them, which creates an interference pattern.
The intrinsic precision of Brillouin measurements is on the order of 0.1–0.5%. Typical frequencies of acoustic waves probed are in the range of tens of GHz. The accuracy of the elastic moduli determination can be in the order of 1%. In combination with a diamond anvil cell high-pressure Brillouin studies possible (to pressures > 100 GPa). High-temperature measurements can be performed using resistively heated DACs (to ~1700 K) or with CO2 laser heating (up to 3000K).
In the experiment monochromatic laser light is focused on a sample. The transparent sample can be either a well-sintered polycrystalline material or a single-crystal with highly-polished parallel (within a few hundredth of a degree) faces. A fraction of the incident light interacts with acoustic vibrations and induces Stokes and Anti-Stokes scattering. The frequency and intensity of the scattered light are measured by an interferometer.
What does a typical Brillouin spectrum look like?
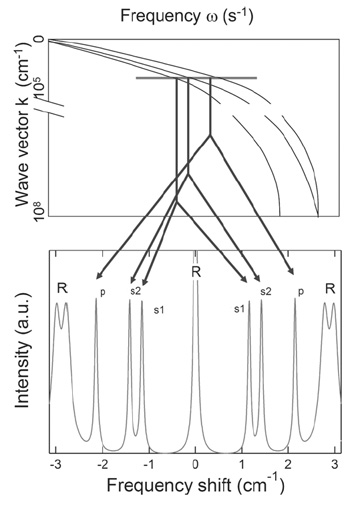
How to determine elastic properties from a Brillouin experiment?
Elastic moduli of a material are related to the acoustic wave velocities and can be calculated using the following equation:
where ρ is the material density, lj,l are the wave direction cosines, ν is the velocity, Uk represents the atom displacements (polarization), and δik is the Kronecker delta (δij = 1 for i = j, δij = 0 for i ≠ 0) .
Literature
[1] Angel, R.J., Jackson, J.M., Reichmann, H.J., Speziale, S. (2009) Elasticity Measurements on Minerals: a Review. European Journal of Mineralogy, 21, 525-550.
[2] Bass, J.D. (2007) Theory and Practice – Techniques for Measuring High P/T Elasticity. In: Price, G.D. (Ed.) Treatise on Geophysics, 2, Elsevier BV, Amsterdam, 269-292.
[3] Bass, J.D. & Parise, J.B. (2008) Deep Earth and Recent Developments in Mineral Physics. Elements, 4, 157-163.
[4] Bass, J.D., Sinogeikin, S.V., and Li, B. (2008) Elastic Properties of Minerals: a key for Understanding the Composition and Temperature of Earth's Interior. Elements, 4, 165-170.
[5] Bassett, W.A. (2001) Dynamic Measurements of Elastic Moduli of Samples at High Pressure and Temperature. In: Levy et al. (Eds.) Handbook of Elastic Properties of Solids, Liquids, and Gases, 1, 469-487.
[6] Every, A.G. (2001) The Elastic Properties of Solids: Static and Dynamic Properties. In: Levy et al. (Eds.) Handbook of Elastic Properties of Solids, Liquids, and Gases, vol. 1, 3-36.
[7] Nye, J.F. (1985) The Physical Properties of Crystals: Their Representation by Tensors and Matrices, Oxford, 329 pp.
Additional Literature
[8] Anderson O.L. & Isaak D.L. (1995) Elastic Constants of Mantle Minerals at High Temperature. In: Ahrens T.J. (Ed.) Mineral Physics and Crystallography: A Handbook of Physical Constants. American Geophysical Union, Washington, D.C., 64 -97.
[9] Auld, B.A. (1990) Acoustic Fields and Waves in Solids, 432 pp.
[10] Polian, A. (2003) Brillouin Scattering at High Pressure: An Overview, J. Raman spectroscopy, 34, 633.
[11] Whitfield, C.H., Brody, E.M., and Bassett, W.A. (1976) Elastic moduli of NaCl by Brillouin scattering at high pressure in a diamond anvil cell. Review of Scientific Instruments, 47, 942-947.
Historical Papers [12] Brillouin, L. (1922) Diffusion de la Lumiere et des Rayons X par un Corps Transparent Homogene: Influence de l'Agitation Thermique. Annales de Physique, 17, 88-122.
[13] Mandelstam, L.I. (1926) Light Scattering by Inhomogeneous Media. Zhurnal Russii Fizicheskoi Khimii Ova., 58, 381.
[14] Weidner, D., Swyler, K. and Carleton, H. (1975) Elasticity of Microcrystals. Geophysical Research Letters, 2, 189-192.
[15] Bassett, W.A. & Brody, E.M (1977) Brillouin Scattering: A new way to Measure Elastic Moduli at High Pressures. In: Manghnani, M.H. & Akimoto, S. (Eds.) High Pressure Research - Applications in Geophysics, New York, 519-532.
Recent Review Papers
[16] Speciale, S., Marquardt, H. & Duffy, T.S. (2014) Brillouin scattering and its application in Geosciences. Reviews in Mineralogy and Geochemistry, 78, 543-603.
Related Links
- A short biography of L.N. Brillouin
- Tutorial on Brillouin zones
- Free software to visualize Brillouin zones
- Java applet to visualize Brillouin zones
Acknowledgements
These materials are being developed with the support of COMPRES, the Consortium for Materials Properties Research in Earth Sciences, under NSF Cooperative Agreement EAR 10-43050 and is partially supported by UNLV's High Pressure Science and Engineering Center, a DOE NNSA Center of Excellence supported under DOE NNSA Cooperative Agreement No. DE FC52-06NA26274.