
Extreme Flooding in Western North Carolina: Hurricane Impacts far from the Coast
Summary

This activity focuses on watershed hydrology where students use rainfall data, stream gauge records, and simplified flow equations to estimate runoff, discharge, and flood heights for a local case study in Western North Carolina. Students interpret and analyze data from Tropical Storm Fred (August 2021) and Hurricane Helene (September 2024), two storms that resulted in extensive flooding along the Pigeon River in the town of Canton, North Carolina. Students analyze how rainfall intensity, channel geometry, slope, and flow resistance influence flooding and apply their results to predict hazard cascades and community impacts downstream.
This activity can be used individually or in conjunction with other land surface hazard activities:
- https://serc.carleton.edu/teachearth/activities/311552.html
- https://serc.carleton.edu/teachearth/activities/312255.html
Development of this resource was supported by theCenter for Land Surface Hazards (CLaSH) - NSF Award ID #2224871.
Any opinions, findings, and conclusions or recommendations expressed are those of the author(s) and do not necessarily reflect the views of CLaSH and/or the NSF.
Context
Audience
This lesson is typically used in an introductory geoscience course for non-majors. It has been used as an in-class assignment where students complete questions in groups.
Skills and concepts that students must have mastered
Typically, students have already been taught how to read and interpret data from graphs and maps, perform simple unit conversions, and apply basic algebra to solve quantitative problems. Additionally, students should have a basic understanding of the water cycle and what defines a watershed. Some familiarity with rivers, flooding, and the idea that water moves downhill across landscapes is helpful but not required. Likewise, prior knowledge of hydrologic concepts such as river channel geometry, slope/gradient, runoff, discharge, and flow resistance can help students strengthen their interpretations and predictions. However, the activity is designed to introduce and reinforce these more advanced concepts during the exercise itself, and no prior knowledge of these topics is required to complete the activity.
The PowerPoint included in the instructor materials provides students with an overview of watershed hydrology, simplified flow equations, and background on the case study.
How the activity is situated in the course
This is a group activity (typically 4 students per group) that is a part of an introductory natural hazards course structured around units focused on different hazards. This is one component of a 2-week unit focusing on watershed hydrology and hazards.
Goals
Content/concepts goals for this activity
- Part 1. Data processing and interpretation
Students will estimate runoff given mapped rainfall data and a downstream hydrograph to demonstrate how rainfall is routed through a watershed. - Part 2. Estimate flood heights
Students will calculate velocity given peak discharge and river cross-sectional area and graph data illustrating the relationship between velocity and stage height to predict flood height.
Higher order thinking skills goals for this activity
- Part 3. Predict impacts of hazard cascade
Students will predict potential flooding due to high-intensity precipitation events given specific river characteristics and reflect on the impacts flooding would have on local communities downstream.
Skills goals for this activity
Students will develop teamwork skills by working in groups. They will develop critical thinking skills as they analyze the equations used to determine how manipulation of equation variables and constants influence predicted flood height.
Description and Teaching Materials
After a brief lecture, students complete a worksheet in small groups. The lecture briefly introduces watershed hydrology and flooding. An outline of the slideshow information is included below and the PowerPoint file is attached. Fred and Helene Slides (PowerPoint 2007 (.pptx) 31.1MB Aug21 26)
Brief outline of slides:
1. Basic concepts in watershed hydrology
- What a watershed is and how is water passed through it (the role of gravity)
- Differences between precipitation, runoff, and the relationship between discharge and river stage (height)
- How rainfall over a watershed is translated into the volume of water downstream
2. What characteristics of rivers matter
- Slope/gradient
- How gradient influences the speed and energy of flow
- Cross-sectional area and water depth
- How channel width and depth impact flood height by changing the amount of water a channel can carry
- Velocity
- Speed of the flow can be related to discharge and channel shape
- Velocity also depends on frictional resistance
3. Relevant equations and their meaning. Note: These simplified equations use assumptions that you can refer to in the attached derivation at the end of the instructor slides:
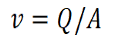
- Students will use conservation of mass to relate discharge, velocity, and area:
- where v = velocity [m/s], Q = discharge [cubic meter/s], and A = cross-sectional area [m2]
-
![[creative commons]](/images/creativecommons_16.png)
- Students will combine conservation of mass with Chezy's equation to estimate flow velocity from channel shape and roughness:
- Where C = roughness coefficient [m1/2/s], y = channel depth [m], w = channel width [m], and S = slope [m/m]
-
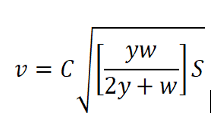
- Together, these equations show how flood velocity and height depend on both the amount of water moving through the channel and the physical properties of the river.
4. Interpreting flood data
- Concept of the hydrograph
- Base flow, rising limb, peak, and falling limb
- How these characteristics are related to extreme rainfall and rapid runoff
5. Preparing students for the case study
- Briefly introduce the local flood event in the activity
- Explain that students will apply concepts from the review of watershed hydrology to estimate runoff, discharge, and flood height
- Clarify that the exercise uses a simplified model (rectangular channel) to help students understand their estimates and limitations of their predictions.
Student Activity:
Students work through Parts 1, 2 and 3 of the handout in small groups to estimate surface runoff from a rainfall event, calculate peak discharge and make predictions about flood height given channel characteristics and river discharge.
Lecture slides: Fred and Helene Slides (PowerPoint 2007 (.pptx) 31.1MB Aug21 26)
Student handout: Student Handout for all parts (Microsoft Word 2007 (.docx) 6.4MB Aug21 26)
Student gauge data for part 2C: Flooding Student Handout Gauges for Part 2C (Acrobat (PDF) 74kB Aug21 26)
Instructor key:
 Instructor Key for Student Handout -- educator-only file
 Hide
HideInstructor key for graphical solutions:
Additional slides for finding data if you would like to use a local dataset: Flooding_Data_Tutorial_Slides.pptx (PowerPoint 2007 (.pptx) 7.4MB Aug21 26)
Teaching Notes and Tips
Part 1 Teaching Notes:
While completing the Table for Part 1A, students are often unwilling to make rough estimates and are very focused on getting the "right answer." The instructor may need to help students be comfortable with this idea. For example, looking at the magnitude of the answer for total rainfall, rather than a specific number.
The "reflection and discussion" question at the end of Table 1A is intended to help transition from Part 1A to Part 1B of the activity. This was included because often when students fill out tables they do not think about what the data in the table means in terms of answering their question and connecting back to the real-world application.
This could be included as short-answer questions for students, a whole-class reflection and regrouping point for the activity, etc.
Students who are struggling with unit conversions could be directed to "The Math You Need" website: https://serc.carleton.edu/mathyouneed/units/index.html
Part 2 and 3 Teaching Notes:
In Part 2 students generally have issues with measuring the slope of the river from the topographic map. Often, they attempt to measure straight lines between the high and low elevation points to get the length of the river segment which leads to an under estimation of river length. It is helpful to have students lay out a string along the course of the river to illustrate the differences in along stream distances from straight line distances.
If students have also completed the dynamic systems model activity (link), question 1 of Part 3 could be replaced with a dynamic systems model.
An instructor key is included in addition to an Excel spreadsheet for estimating runoff volume in Part 1B and flood predictions in Part 2B. Also, we provide the hydrographs needed for question 7 of Part 2C: Data Analysis and Interpretation.
Assessment
Although grading criteria provided look for good faith completion, an activity key is included so that the instructor can provide students with feedback on their calculations and data interpretation. Answers from the activity key for table 1 (Part 1A) and table 2 (Part 1B) will differ from students' answers due to differences in estimation. The order of magnitude should remain the same as the key.
References and Resources
Development of this resource was supported by the Center for Land Surface Hazards (CLaSH) - NSF Award ID #2224871.