What's in Your Water? Applying Hydrogeology to Real World Problems.
Summary
In this activity students are guided through how geologic and chemical processes can affect water chemistry and quality. The activity progresses through: - water-rock interactions and weathering
- chemical signatures of water sources/watersheds
- concepts of chemical concentration, pH, and mineral dissolution
- chemical speciation in relation to pH
- applying what students learn to a fictional water contamination scenario modeled after the Flint, Michigan water crisis.
Students will gain experience interpreting graphs and seeing real life examples of chemistry in action.
Context
Audience
Targeted audience is introductory environmental undergraduate courses (100-200 level) such as:
- Environmental Science
- Geology
- Earth Systems
- Chemistry courses with an environmental focus
Could possibly be used in a high school setting as an AP assignment
Skills and concepts that students must have mastered
General high school chemistry (elements, ions, chemical formulas, pH)
Basic reading comprehension
How the activity is situated in the course
This activity works as a 75-90 minute in-class activity or lab. It works best as an early lab of a course because it introduces and ties together disparate scientific concepts by giving a real life example as a conclusion to the activity.
Goals
Content/concepts goals for this activity
- Water chemistry depends on watershed composition, water-rock interactions, and weathering
- Mineral dissolution changes water chemistry
- Water pH and ions present in solution change what molecules can form
- Connecting scientific principles to real world environmental problems
Higher order thinking skills goals for this activity
- Students hypothesize about a complex real world environmental problem
- Students analyze graphs and diagrams presented to form hypotheses
- Students think about what type of data would be needed to solve a problem
Skills goals for this activity
Searching the world wide web for the pH of common things students may interact with daily
Description and Teaching Materials
This activity is split into three sections and is a guided inquiry style activity that could be completed individually or in small groups.
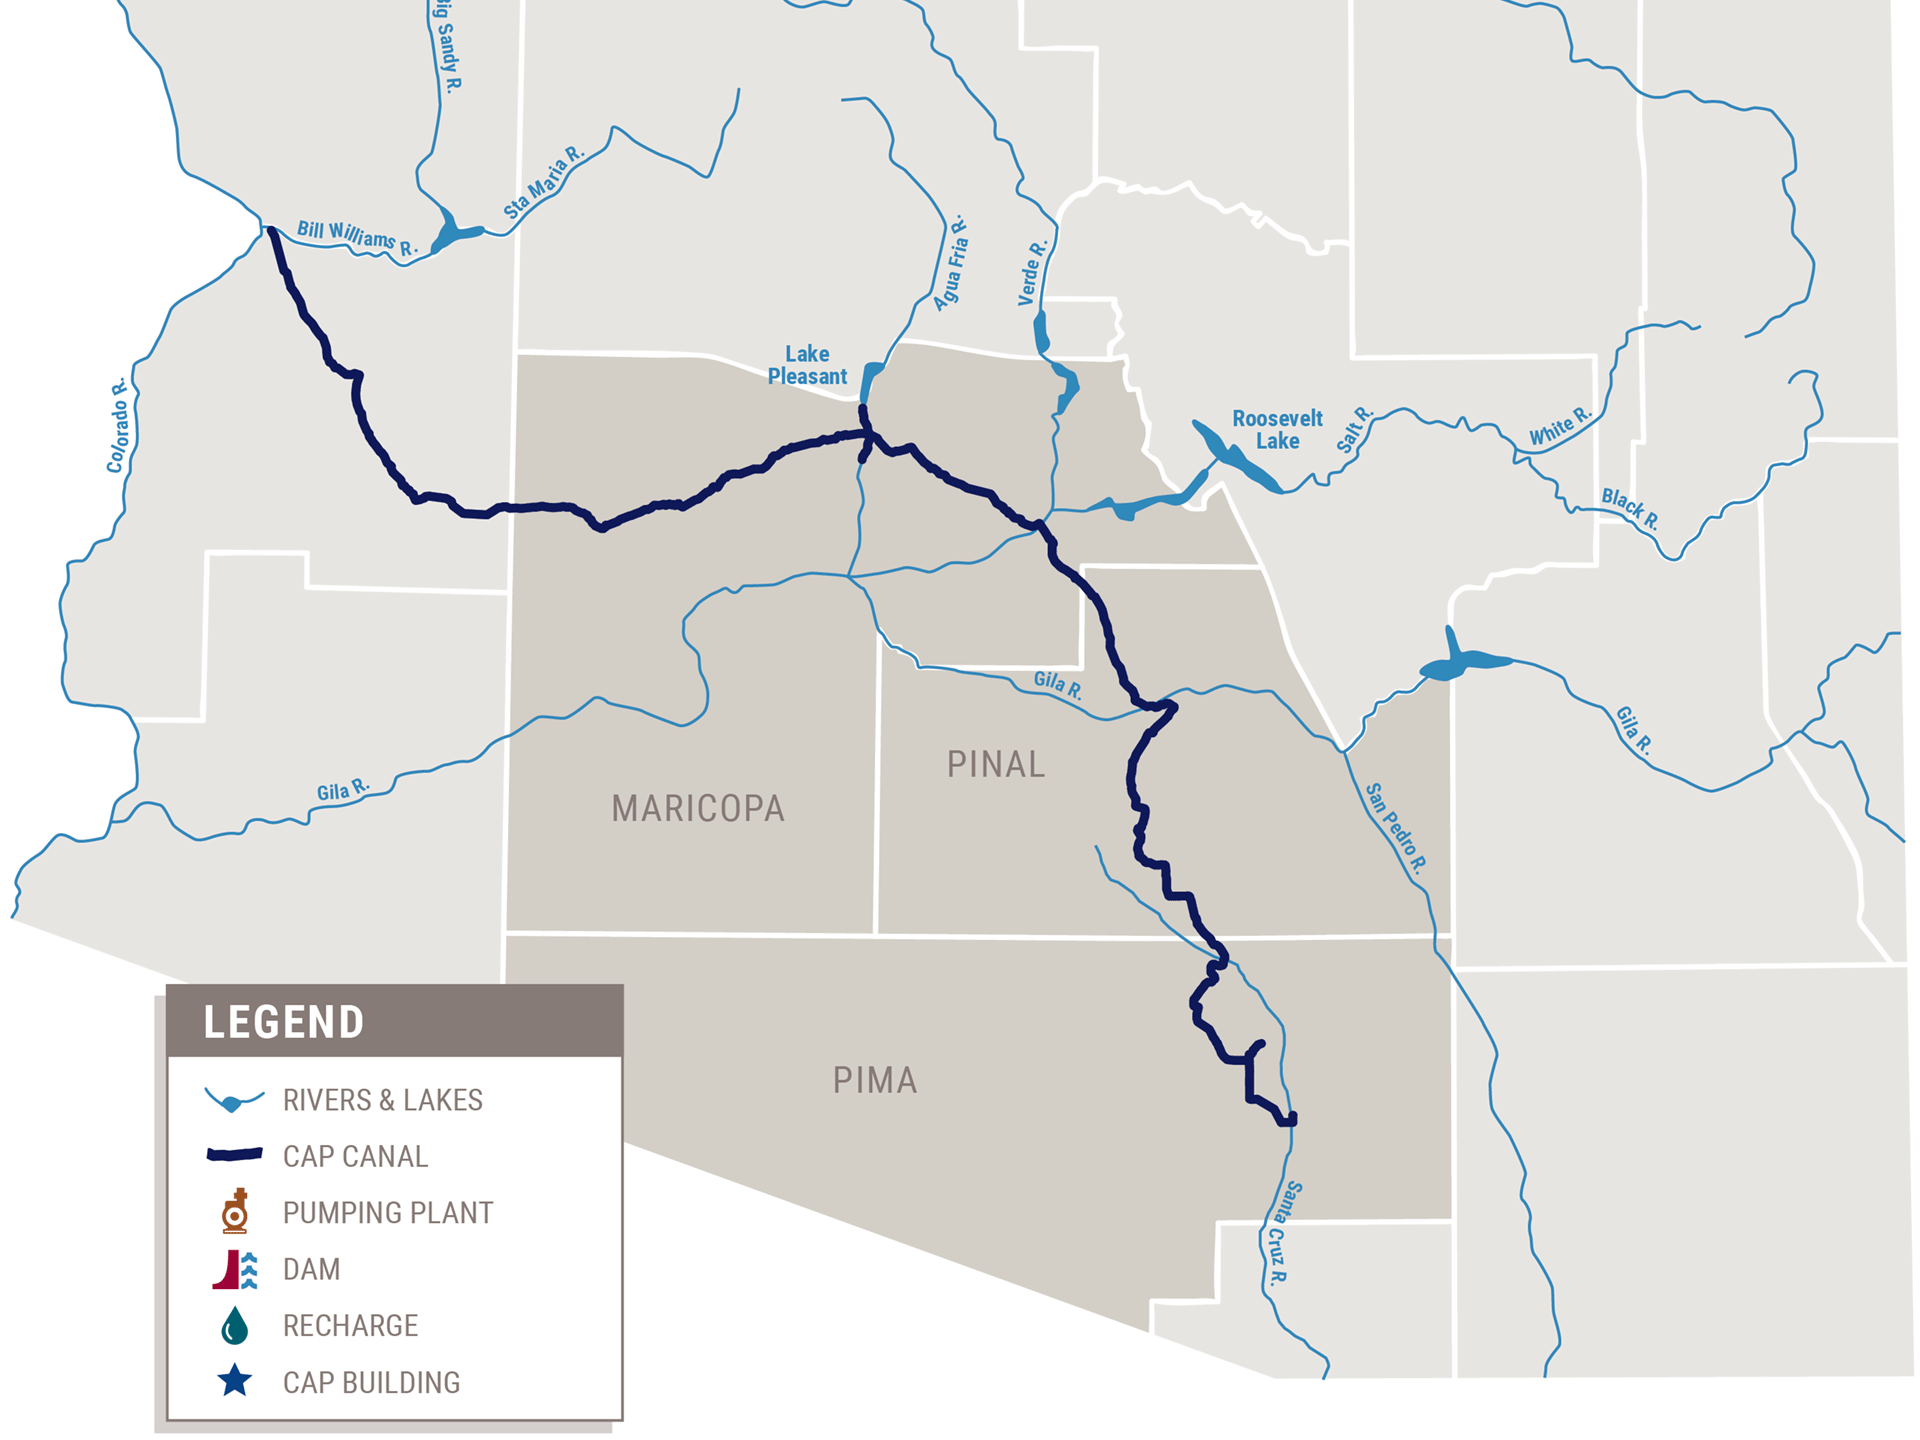
- Part one is about how water and geology interact. Students make predictions about where they think Arizona's water comes from. Then they analyze watershed maps and photos of water in each watershed to think about possible compositional differences. Students interpret a ternary diagram of water chemistry and observe a visual example of rivers mixing.
- Part two is about the chemistry of water and how minerals can dissolve in water to make different chemical compositions. Analogies are used to explore concepts of concentration and chemical speciation. pH is introduced and discussed as a factor that influences water chemistry.
- Part three is a real world application of what the students learned in parts one and two. A fictional case study is discussed where a town's drinking water is contaminated with lead and the students are brought along as the investigators find out what happened. Students are asked to interpret a pre-produced plot of pH vs lead concentration in drinking water that was modeled using the chemical thermodynamic tool "WORM". This section is based on the Flint water crisis.
The only external material required to complete this activity is a connection to the internet where the student can look up pH values of common substances.
Students may need instruction on ternary diagrams if not covered in class. A YouTube video is suggested in the instructor version of the material.
Student and instructor versions exist.
Student only version has "(Student Version)" in the file name with answers removed. Instructor only version has "(Instructor Version)" in the file name and blue highlighted page headers that say "INSTRUCTOR VERSION, NOT FOR DISTRIBUTION TO STUDENTS".
Word document and PDF for each version (student and instructor) so that instructors can edit the word versions if needed but the images and structure of the document are preserved in PDF form so they can see the original format in case formatting changes between editing programs.
MS Word version of student handout for "What's in your water?" assignment. (Microsoft Word 2007 (.docx) 9MB Jun27 25)
PDF version of student handout for "What's in your water?" assignment. (Acrobat (PDF) 7.9MB Jun27 25)
Teaching Notes and Tips
Ternary diagrams are a common area of confusion for students, this activity was designed to come after class instruction on ternary diagrams. If you are not covering ternary diagrams in your course you might want to include a youtube video like this one (https://www.youtube.com/watch?v=h8tFnC4pNGc) before the ternary section. There is also a SERC instructional page: https://serc.carleton.edu/mathyouneed/geomajors/ternary/index.html
This activity has multiple questions asking the students to form hypotheses and then they are asked to revise their hypotheses later if needed. They might not come up with the "correct" hypothesis but part of the activity is to get them to think about how to integrate multiple scientific pieces of data to approach a real world problem. Their scientific intuition will improve with further class discussion.
Assessment
Some questions in this activity have definitive answers while others are more open ended and are included to get the student to form/revise hypotheses.
Students can be tested about the content of this activity outside of the questions included in the activity but there are clearly marked questions that can have point values assigned to them at the instructor's discretion.
References and Resources
Figure 1: Arizona watersheds and pictures
- CAP canal line
- https://www.cap-az.com/water/cap-system/water-operations/system-map/
- https://www.cap-az.com/wp-content/uploads/2021/07/img-system-map-blank-2021.png
- Verde River Image
- https://www.nature.org/en-us/get-involved/how-to-help/places-we-protect/verde-river/
- Salt River (Upstream) Image
- https://earthly-musings.blogspot.com/2010/05/rafting-rapids-and-geology-of-salt.html
- Colorado River Image
- https://www.politico.com/news/2023/02/04/colorado-river-biden-climate-change-water-00080990
- Arizona watersheds map:
- https://19january2021snapshot.epa.gov/urbanwaterspartners/rio-reimagined-rio-salado-urban-waters-partnership_.html
Figure 2: Halite mineral picture and NaCl dissolving
- https://commons.wikimedia.org/w/index.php?curid=49736222)
- Lech Darski - Own work, CC BY-SA 4.0 , via Wikimedia Commons
- https://commons.wikimedia.org/wiki/File:NaCl_dissolving.png
- Ahazard.sciencewriter, CC BY-SA 4.0 , via Wikimedia Commons
Figure 3: Ternary diagram
- Generated by Vince Debes with idealized river data using Origin Graphical Software version 2019
Figure 4: Rivers in Geneva Switzerland
- https://unusualplaces.org/confluence-of-rhone-and-arve-rivers-geneva/
Figure 5: Food coloring concentration example
- Generated by Peyton Idleman
Figure 6: Flint, MI drinking water samples
- https://www.cbsnews.com/news/usa-today-network-report-lead-contamination-in-water-nationwide-levels-rival-flint/
Figure 7: Pipe scale build up
- https://www.usgs.gov/media/images/hardness-water-lime-scale-buildup-inside-water-pipe
Figure 8: Lead vs. pH diagram
- Generated by Vince Debes using the Water-Organic-Rock-Microbe (WORM) Portal, an open source tool for performing thermodynamic calculations.
- https://worm-portal.asu.edu/ - Input water quality data is from the following sources.
- https://www.michigan.gov/flintwater/water-infrastructure-projects/monitoring/wqa-flint-dist/city-of-flint-distribution-system-monitoring-data-expanded-data-set
- 2022-05-09 Sample point 1
- https://www.cityofflint.com/wp-content/uploads/2023/06/Annual-Water-Quality-Report-2022.pdf
- Dissolved oxygen data from Springwell Treatment Plant:
- https://dearbornheightsmi.gov/DocumentCenter/View/1784/Water-Quality-Report-2022-PDF?bidId=
In text links
- Global water cycle
- https://www.usgs.gov/special-topics/water-science-school/science/water-cycle
- Halite in the Salt River watershed
- https://www.mindat.org/loc-53707.html
- Anhydrite in the Colorado River watershed
- https://pubs.usgs.gov/bul/1715c/report.pdf
- Ternary plot information
- https://serc.carleton.edu/mathyouneed/geomajors/ternary/index.html
- 9-13 million lead service pipe information
- https://www.nrdc.org/resources/lead-pipes-are-widespread-and-used-every-state
- 2022 Flint 6 year compliance
- https://mphdegree.usc.edu/blog/the-flint-water-crises/
- Continued monitoring and infrastructure efforts in Flint
- https://www.cityofflint.com/progress-report-on-flint-water/
- American Chemical Society detailed information about Flint crisis
- https://cen.acs.org/articles/94/i7/Lead-Ended-Flints-Tap-Water.html