Semi-log and Log-log Plots - Practice Problems
Solving Earth science problems with Semi-log and Log-log plots
This module is undergoing classroom implementation with the Math Your Earth Science Majors Need project. The module is available for public use, but it will likely be revised after classroom testing.
Species distribution

Bird near an island in the South Pacific.
![[creative commons]](/images/creativecommons_16.png)
Provenance: https://picryl.com/media/bora-bora-south-pacific-polynesia-travel-vacation-7bbf63
Reuse: This item is offered under a Creative Commons Attribution-NonCommercial-ShareAlike license http://creativecommons.org/licenses/by-nc-sa/3.0/ You may reuse this item for non-commercial purposes as long as you provide attribution and offer any derivative works under a similar license.
Due to competition pressure and available resources, populations of organisms are limited in the space they occupy, or their habitat. One example of this relationship can be demonstrated by the number of bird species found in the Solomon Islands of the South Pacific.
Problem 1: Using the table below, determine an equation that could be used to estimate the number of species for a given island area (data from Langkamp & Hull, 2007, Quantitative Reasoning and the Environment). The area of the island of New Georgia is 786 mi2. Given the data from the islands below, how many species would you expect to find on the island of New Georgia?
| Island Name |
Area (mi^2) |
No. of Bird species |
| Bougainville |
3317 |
82 |
| Guadalcanal |
2039 |
79 |
| Ysabel (Isabel) |
1581 |
71 |
| Choiseul |
1145 |
70 |
| Buka |
236 |
63 |
| Nggela |
142 |
61 |
| Shortland |
90 |
58 |
| Fauro |
27 |
51 |
Step 1: EVALUATE the data to assess the ranges of the variables.
The data in this table is organized in descending order based on island area. Remember that usually data is much "messier" and it doesn't need to be set up this way. But let's take advantage of the fact that the data is sorted. The area, which is the independent variable in this example, ranges from 27 to 3317 square miles, which is three orders of magnitude (27 ~ 10
1, 3317 > 10
3) and since 3317 is OVER 1000, we should consider axes from at least 10 (10
1 or 1E+1) to 10,000 (10
4 or 1E+4). It is conventional to put the independent variable on the x-axis, so we should expect to set our x-axis as logarithmic.
The number of bird species on each island is the dependent variable, so we'll plot that on the y-axis. This range is only from 51 to 82, so all the values are within ONE order of magnitude (between 101 and 102). This suggests that we should leave the y-axis as normal, which is the default in Excel.
What we have here will be well-represented in a semi-log plot!
Step 2: CREATE an x-y scatter plot of the data.
There are a lot of steps to create an Excel plot, and a lot of choices to make along the way. We're going to emphasize the typical utilities used by Earth scientists. If you are new to Excel, and especially if you are considering a career in STEM, we STRONGLY recommend you become familiar with Excel or a comparable spreadsheet program. It will make your life as a student much easier AND it will make you eminently more competitive as a professional when you are entering the job market.
Try this Microsoft Office chart web page as a starting point to get help.
- The first step is making sure you have the data in an Excel sheet! Copy the table above into Excel. The program USUALLY (not always) will recognize tabular data and separate it into rows and columns.
- Put your cursor in a cell that DOES NOT have any data. Use the "Insert" tab and select "Scatter (X-Y)" under Charts. This will bring up either a blank chart or a weird-looking one or even a correct one! But the blank or weird option is the one we'll work from.
- The Chart window will appear. Choose "Select Data." If Excel opened the chart and it looks wrong, with multiple data points, or strange text, remove any of the "Series" that are in the window for Legend Entries. This will get you to a blank chart. If Excel opened the chart as blank, you're ready for the next step.
- Choose to Add a Series in the Select Data window. A new window will pop up with three boxes. In the first box for Series Name, type "Bird Species vs. Area." Click the icon at the end of the second box for Series X values to allow you to choose your x-axis data, in this case the island area. Click the icon at the end of the third box for Series Y values to allow you to choose your y-axis data, in this case the No. of Bird species.

Select Data in Excel screenshot for Practice Problem 1, Bird Species vs. Area.
![[reuse info]](/images/information_16.png)
Provenance: Kyle Fredrick, Pennsylvania Western University
Reuse: This item is in the public domain and maybe reused freely without restriction.
- Click OK for the Edit Series and then for the Select Data windows. Now your data is in the graph and it is time to manipulate the axes based on your determination that this should be a Semi-log plot. Because we determined that the bird species is NOT logarithmic, we can leave the y-axis alone. Right-click on the x-axis on the chart. Choose to "Add Minor Gridlines." Right-click the x-axis again and choose to "Format Axis." Under Axis Options, click the radio button for Logarithmic scale (leave the Base as 10).

Excel step to choose Log scale for Practice Problem 1.
Provenance: Kyle Fredrick, Pennsylvania Western University
Reuse: This item is in the public domain and maybe reused freely without restriction.
At this point, you have created your Excel plot and it's time to move on to Step 3, adding the trendline. Here is what the graph would look like at this stage, if you label your axes and spend some time making this presentable for an audience.

Plotted Data of Bird Species vs Area for Practice Problem 1.
Provenance: Kyle Fredrick, Pennsylvania Western University
Reuse: This item is in the public domain and maybe reused freely without restriction.
Step 3: Add a TRENDLINE to the graph.
In the chart area, hover over one of the data points. Right-click your mouse and choose to "Add Trendline."

Adding a Trendline step, Practice Problem 1.
Provenance: Kyle Fredrick, Pennsylvania Western University
Reuse: This item is in the public domain and maybe reused freely without restriction.
In the Format Trendline window, click through the radio buttons for the different functions and choose the best one. Hopefully, you recognize that the "Logarithmic" function is the best one this time. Click the radio button to "Display Equation on Chart."

Completing the trendline for Practice Problem 1.
Provenance: Kyle Fredrick, Pennsylvania Western University
Reuse: This item is in the public domain and maybe reused freely without restriction.
And here is the final chart WITH the Trendline and the Equation that represents an approximation of the mathematical relationship between the number of bird species depending upon island area of the Solomon Islands!

Finished graph of Birds vs. Area for Practice Problem 1, including trendline and equation.
Provenance: Kyle Fredrick, Pennsylvania Western University
Reuse: This item is in the public domain and maybe reused freely without restriction.
The relationship is $y = 5.9619 ln(x) + 30.842$ This means that we can predict the number of bird species (y) we expect to find on any given island in the Solomon Islands archipelagoA chain, cluster, or collection of islands, generally related by specific regional geologic origins., by plugging in the island's area for x and solving the equation.
Step 4: ANALYZE the graph to determine the relationship between variables.
The question was, how many bird species would we expect to find on the Solomon Island of New Georgia, with its area of 786 mi
2. If we plug 786 in for x, we can use the natural log function to solve the question for y.
$y = 5.9619 * ln(786) + 30.842$
$ln(786) = 6.67$
$y=5.9619*(6.67) + 30.842$
$y = 39.75 + 30.842 = 70.59$
Since we obviously can't have 70.6 species of birds, we would estimate that the island of New Georgia has 71 species of birds!
Hydrology - Rating Curve for Stream flow

River stage pole.
Provenance: https://commons.wikimedia.org/wiki/File:The_gauge_at_the_junction_of_the_Lour_Burn_and_the_River_Spey_by_Aberlour_-_geograph.org.uk_-_357150.jpg
Reuse: This item is offered under a Creative Commons Attribution-NonCommercial-ShareAlike license http://creativecommons.org/licenses/by-nc-sa/3.0/ You may reuse this item for non-commercial purposes as long as you provide attribution and offer any derivative works under a similar license.
Hydrologists use log plots in many different applications. One of the most common is the development of a stream's rating curve. This is the determination of a stream's relationship between its flow (we'll call it discharge in this problem) and its "stage." Stage is just the water level, but we can't say "depth" or "elevation" or even "level" without knowing where the value is being measured from, called the datum. But, simply put, a stream's discharge obviously increases as its stage increases. High water means more water in a flowing stream! Check out this page from the
USGS for an explanation.
Problem 2: A hydrologist with the US Geological Survey has been tasked with creating a rating curve for a local stream. It's difficult, time-consuming work to measure a stream's flow, so her boss has assigned her this task to complete over a one-year period, taking measurements at least 2-3 times a month, but preferably more. When she is done, her data will be used as the basis for discharge estimation so that the only thing that needs to be recorded is stage, saving the agency the time, money, and man-power of having to continue to go in the field and take direct discharge measurements. Here are her data:
| Date |
River Height (ft asl) |
Stage (ft above datum 790 ft) |
Discharge (cfs) |
| 16-Jan |
795.15 |
5.15 |
835 |
| 27-Jan |
795.09 |
5.09 |
798 |
| 9-Feb |
794.70 |
4.70 |
527 |
| 21-Feb |
795.38 |
5.38 |
1030 |
| 28-Feb |
796.42 |
6.42 |
2100 |
| 10-Mar |
796.36 |
6.36 |
1950 |
| 19-Mar |
796.76 |
6.76 |
2350 |
| 1-Apr |
796.69 |
6.69 |
2280 |
| 8-Apr |
796.96 |
6.96 |
2570 |
| 16-Apr |
796.68 |
6.68 |
2200 |
| 24-Apr |
796.54 |
6.54 |
2120 |
| 6-May |
796.37 |
6.37 |
1960 |
| 19-May |
795.68 |
5.68 |
1390 |
| 2-Jun |
794.43 |
4.43 |
380 |
| 5-Jun |
794.33 |
4.33 |
334 |
| 22-Jun |
794.19 |
4.19 |
278 |
| 5-Jul |
793.86 |
3.86 |
166 |
| 23-Jul |
793.54 |
3.54 |
85 |
| 31-Jul |
793.80 |
3.80 |
144 |
| 6-Aug |
793.67 |
3.67 |
110 |
| 12-Aug |
793.55 |
3.55 |
84 |
| 26-Aug |
793.83 |
3.83 |
147 |
| 25-Sep |
793.55 |
3.55 |
80 |
| 2-Oct |
794.32 |
4.32 |
300 |
| 14-Oct |
793.99 |
3.99 |
187 |
| 19-Oct |
794.66 |
4.66 |
469 |
| 27-Oct |
794.19 |
4.19 |
249 |
| 4-Nov |
794.53 |
4.53 |
394 |
| 8-Nov |
794.35 |
4.35 |
313 |
| 19-Nov |
794.39 |
4.39 |
327 |
| 8-Dec |
794.45 |
4.45 |
356 |
| 14-Dec |
794.55 |
4.55 |
405 |
| 23-Dec |
794.57 |
4.57 |
418 |
| 30-Dec |
794.59 |
4.59 |
428 |
The first column is the date the scientist went into the field and took measurements of both stage (water level) and discharge. The second column, River Height, is reported in feet "above sea level," (ft asl). It is common to use mean sea level as a datum A base, or zero, value that all measurements in a set are taken from. for consistency. Depth cannot be used because a stream's depth will change due to flooding, dredging, or natural bed movement over time. Other times, a local datum may be used. In this case, the stream's elevation is adjusted to the LOCAL DATUM of 790 feet above sea level, which is the third column. Finally, the fourth column is the stream's flow, or discharge, measured in cubic feet per second (cfs). Optimally, we would be working in the metric system, but the USGS still uses cfs and often reports stage in feet, as well.
What is the function of the data for this rating curve? If the maximum flood stage is 797.5 ft asl (7.5 feet above datum), what would the discharge be at that level? Would you agree that she has collected enough data to be confident in her function?
Step 1: EVALUATE the data to assess the ranges of the variables.
The stream's stage is measured over a small range of only a few feet. But in this relatively flat topography, that is actually significant. However, the discharge is measured over three orders of magnitude with a low of 80 cfs and a high of 2570 cfs. Rating curves are widely used in hydrologic applications, and are conventionally displayed with the discharge on the y-axis. With such a large range, we'll set the discharge (y-axis) as logarithmic, but leave the stage (x-axis) as standard.
This presents us with a great example of a commonly used Semi-Log plot!
Step 2: CREATE an x-y scatter plot of the data.
We've gone through several examples of creating Excel plots. Don't hesitate to look for help on this, as getting better at Excel, or spreadsheet programs in general, will make you a better student and scientist.
- Copy the table above into Excel. The program USUALLY (not always) will recognize tabular data and separate it into rows and columns.
- Put your cursor in a cell that DOES NOT have any data. Use the "Insert" tab and select "Scatter (X-Y)" under Charts. This will bring up a blank chart, or a weird-looking one, or even a correct one! NOTE: Excel prefers to work in time series, so it may grab the Date column by default and plot the stage and discharge both against time. We'll want to start from a blank chart.
- Choose "Select Data." If Excel opened the chart and it looks wrong, remove any of the "Series" that are in the window for Legend Entries to get to a blank chart. If Excel opened the chart as blank, you're ready for the next step.
- Choose to 'Add a Series' in the Select Data window. A new window will pop up with three boxes. In the first box for Series Name, type "Rating Curve." Click the icon at the end of the second box for Series X values to allow you to choose your x-axis data, in this case, the stage from the third column. Click the icon at the end of the third box for Series Y values to allow you to choose your y-axis data, in this case it is the discharge from the fourth column.
- Click OK for the Edit Series and then for the Select Data windows. Now your data is in the graph, and it is time to manipulate the axes based on your determination that this should be a Semi-log plot. Because we determined that stage is such a short range, we will leave the x-axis alone, except to set the minium and maximum at 3 and 8 feet, respectively. However, for the y-axis, discharge, we'll make some changes. Under Axis Options, click the radio button for Logarithmic scale (leave the Base as 10). Right-click on the y-axis on the chart. Choose to "Add Minor Gridlines." Right-click the y-axis again and choose to "Format Axis."
At this point, you have created your Excel plot and it's time to move on to Step 3, adding the trendline. Here is what the graph would look like after a few aesthetic changes for presentation purposes.

Rock River data plot of Rating Curve.
Provenance: Kyle Fredrick, Pennsylvania Western University
Reuse: This item is in the public domain and maybe reused freely without restriction.
Step 3: Add a TRENDLINE to the graph.
In the chart area, hover over one of the data points. Right-click your mouse and choose to "Add Trendline."
In the Format Trendline window, choose the best option that fits your data. In this case, you may recognize that the "Power" function is the best one this time. Click the radio button to "Display Equation on Chart."
Here is the final chart WITH the Trendline and the Equation that represents a model of the stream's behavior with respect to changes in discharge relative to stage.

Final Rating Curve with the Trendline.
Provenance: Kyle Fredrick, Pennsylvania Western University
Reuse: This item is in the public domain and maybe reused freely without restriction.
The relationship is $y=0.1814x^{5.0385}$. This means that we can predict the stream's discharge (y) based on monitoring the stream's elevation (stage). This is critically important for flood prediction because, from upstream to downstream, the elevation changes, as well as the shape and depth of the channel. But if we have an established rating curve, we can use it going forward, as above getting discharge from stage. OR we can use it the other way and use upstream discharge to predict the height of floodwaters at a downstream location.
Step 4: ANALYZE the graph to determine the relationship between variables.
We've determined the answer to the first question, what is the function for this rating curve, as $y = 0.1814x^{5.0385}$.
But to consider the subsequent questions, let's take them one at a time: If the maximum flood stage is 797.5 ft asl (7.5 feet above datum), what would the discharge be at that level?
$y = 0.1814x^{5.0385}$
$y = 0.1814*(7.5)^{5.0385}$
$y = 0.1814*25644$
$y = 4652 cfs $
The answer is 4,652 cubic feet per second. Does that match the trendline above, if you were to extend it to 7.5 ft above datum?
And finally, would you agree that she has collected enough data to be confident in her function? This is a more difficult question. Note the fit of the trendline to the data; it isn't great. It is expected that with more data, the trendline would better represent the relationship, but there are no guarantees. However, it may be advisable to continue collecting data for another six months to a year to capture another annual flow cycle.
Atmosphere Pollution

Ozone hole in September 2009.
Provenance: https://commons.wikimedia.org/wiki/File:Ozonloch.jpg
Reuse: This item is offered under a Creative Commons Attribution-NonCommercial-ShareAlike license http://creativecommons.org/licenses/by-nc-sa/3.0/ You may reuse this item for non-commercial purposes as long as you provide attribution and offer any derivative works under a similar license.
In 1985, data were published that ultimately led to one of the great global environmental collaborations in history. A hole in the
ozoneThe resulting chemical when three oxygen are bonded as O3. layer over Antarctica was discovered that concerned scientists because the ozone layer, though not well publicized before, was recognized as a critical and especially vulnerable part of Earth's atmosphere, protecting life from damaging ultraviolet radiation from the sun. Over several years, it was determined that the Antarctic "Ozone Hole" was expanding, and formation of new smaller holes and thinning were occurring over global population centers. Scientists determined that the culprit was a family of molecules called chlorofluorocarbons, or CFC's, used widely in refrigerators, fire suppressants, air conditioners, and common household aerosols (like hair spray, deodorant, and ironically, air fresheners). In 1987, the Montreal Protocol was drafted by the United Nations Environment Programme and went into effect in 1989. It phased out production and use of CFC's globally, though with caveats where comparable products were not readily available. Since that time, the Antarctic Ozone Hole has mostly "healed" and the world has celebrated this joint effort to protect our global environment through cooperation and mutual respect.
Problem 3: Using the data in the table for CFC atmospheric concentration, determine the equation that describes the relationship between CFC's and years since 1935 to determine how CFC's have reduced in concentration over time. Based on these data, consider the following questions: (1) Based on the equation you determined from the dataset, did the CFC concentration in the atmosphere decrease after the Montreal Protocol? (2) If the Montreal Protocol had NOT been crafted and gone into effect (in 1989), what would the atmospheric CFC concentration be today?
| Year |
Year since 1935 |
CFC (ppt) |
| 1940 |
5 |
0.4 |
| 1945 |
10 |
1.7 |
| 1950 |
15 |
7.6 |
| 1955 |
20 |
17.4 |
| 1960 |
25 |
35 |
| 1965 |
30 |
69.3 |
| 1970 |
35 |
132 |
| 1975 |
40 |
228.2 |
| 1980 |
45 |
323.2 |
| 1985 |
50 |
403.4 |
| 1990 |
55 |
497.7 |
| 1995 |
60 |
533.4 |
| 2000 |
65 |
545.9 |
| 2005 |
70 |
544.9 |
| 2010 |
75 |
532.46 |
| 2015 |
80 |
517.93 |
| 2020 |
85 |
499.81 |
These data are from the National Oceanographic and Atmospheric Administration, National Centers for Environmental Information. The CFC is taken from the CFC-12 species in the Northern Hemisphere for the years indicated.
Step 1: EVALUATE the data to assess the ranges of the variables.
In column one of the table, the year is given in 5-year increments. In column two, the CFC concentration is listed in "ppt," or parts per trillion.
Since time (in this case years) is the independent variable, we'll put it on the x-axis. The atmospheric concentration of CFC's is the dependent variable, so we'll plot that on the y-axis. This range is only from 0.4 to over 540 ppt, so the values are spread across four orders of magnitude (from 10-1 to 103). This suggests that we should make the y-axis logarithmic, while leaving the years normal on the x-axis.
The data will be well-represented on a Semi-Log plot!
Step 2: CREATE an x-y scatter plot of the data.
Refer to previous examples of creating Excel plots. Remember, getting better at Excel, or spreadsheet programs in general, will make you a better student and scientist.
- Copy the table above into Excel. The program usually (not always) will recognize tabular data and separate it into rows and columns. Because you are using dates here, you should make sure that Excel will NOT override the values and turn them into different numbers. If this happens, highlight the cell and change the formatting to "Number" in the Home tab.
- Put your cursor in a cell that DOES NOT have any data. Use the "Insert" tab and select "Scatter (X-Y)" under Charts. This will bring up a blank chart, or a weird-looking one, or even the correct one. We'll want to start from a blank chart.
- Choose "Select Data." If Excel opened the chart and it looks wrong, remove any of the "series" that are in the window for Legend Entries to get to a blank chart. If Excel opened the chart as blank, you're ready for the next step.
- Choose to 'Add a Series' in the Select Data window. A new window will pop up with three boxes. In the first box for Series Name, type "Global CFC's over time." Click the icon at the end of the second box for Series X values to allow you to choose your x-axis data, in this case the years since 1935 from Column B. Click the icon at the end of the third box for Series Y values to allow you to choose your y-axis data, in this case the CFC (ppt) from the Column C.
- Click OK for the Edit Series and then for the Select Data windows. Because this example is a little more complicated, it might be interesting to take a look at the raw graph.

CFCs over time for a standard graph
Provenance: Rory McFadden, Carleton College
Reuse: This item is offered under a Creative Commons Attribution-NonCommercial-ShareAlike license http://creativecommons.org/licenses/by-nc-sa/3.0/ You may reuse this item for non-commercial purposes as long as you provide attribution and offer any derivative works under a similar license.
Now that your data is in the graph, it is time to manipulate the axes based on your determination that this should be a Semi-log plot. Right-click the y-axis, and choose to "Format Axis." Under Axis Options, click the radio button for Logarithmic scale (leave the Base as 10). Right-click on the y-axis on the chart. Choose to "Add Minor Gridlines." NOTE: If Excel has the axes crossing the other at 1, you can change that under the Format Axis window. Change the 'horizontal axis crosses' value to 0.1 with the radio button for axis value.
At this point, you have created your Excel plot, and it's time to move on to Step 3, adding the trendline. Here is what the graph would look like after a few aesthetic changes for presentation purposes.

CFCs over time semi-log graph
Provenance: Rory McFadden, Carleton College
Reuse: This item is offered under a Creative Commons Attribution-NonCommercial-ShareAlike license http://creativecommons.org/licenses/by-nc-sa/3.0/ You may reuse this item for non-commercial purposes as long as you provide attribution and offer any derivative works under a similar license.
Step 3: Add a TRENDLINE to the graph.
In the chart area, hover over one of the data points. Right-click your mouse and select "Add Trendline."
In the Format Trendline window, choose the best option that fits your data. In this case, the power function provides the best fit. Click the radio button to "Display Equation on Chart."
Here is the final chart with the trendline and the equation for a power relationship between CFC atmospheric concentration vs. time since 1935.

CFCs over time semi-log with trendline and equation
Provenance: Rory McFadden, Carleton College
Reuse: This item is offered under a Creative Commons Attribution-NonCommercial-ShareAlike license http://creativecommons.org/licenses/by-nc-sa/3.0/ You may reuse this item for non-commercial purposes as long as you provide attribution and offer any derivative works under a similar license.
The relationship is $y=0.0046x^{2.7873}$. This means that we can determine the CFC concentration in a given year using this equation.
Step 4: ANALYZE the graph to determine the relationship between variables.
The CFC concentration in the atmosphere did not decrease immediately after the Montreal Protocol, but the increase diminished rapidly and the CFC concentration did begin to decrease. This is visible in the abrupt change in slope of the graph in the late 1980s. We also know the Ozone Hole diminished. Most scientists interpret these data to show the Montreal Protocol was successful.
Using the data before 1990, we can estimate the CFC concentration today, if the Montreal Protocol had not been crafted and gone into effect (in 1989).
Using your semi-log chart, right-click on a data marker and choose to "Select Data." Change the data source so that you are ONLY using data from the forty-year period 1945 through 1985 (or 10 to 50 for years since 1935). Follow the same instructions as above to produce a new graph for this shorter, pre-Montreal Protocol timeline.
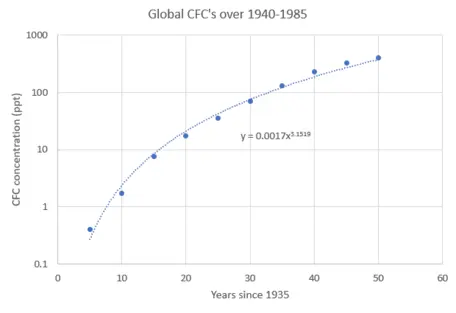
CFCs over time from 1945-1985 semi-log with equation
Provenance: Rory McFadden, Carleton College
Reuse: This item is offered under a Creative Commons Attribution-NonCommercial-ShareAlike license http://creativecommons.org/licenses/by-nc-sa/3.0/ You may reuse this item for non-commercial purposes as long as you provide attribution and offer any derivative works under a similar license.
Using the equation $y=0.0006x^{3.448}$, we can try to estimate CFC's for a modern year. Let's use 90 years (or the year 2025) for "x."
$y=0.0006x^{3.448}$
$y=0.0006*90^{3.448}$
$y=0.0006*1,398,626.8$
$y=839.2 ppt $
This suggests that without the Montreal Protocol that modern atmospheric CFC levels would be approaching 840 ppt. Based on this analysis, it can generally be agreed upon that the Montreal Protocol was successful, having shown that (a) CFC levels have begun to diminish as of the late 1990's, and (b) without it, CFC concentrations would far exceed their current levels.
Groundwater Contamination - Decay of PFAS

PFAS foam in Van Ettan Lake in Oscoda, Michigan near the former Wurtsmith Air Force Base.
Provenance: https://www.flickr.com/photos/michigandeq/39601591511
Reuse: This item is offered under a Creative Commons Attribution-NonCommercial-ShareAlike license http://creativecommons.org/licenses/by-nc-sa/3.0/ You may reuse this item for non-commercial purposes as long as you provide attribution and offer any derivative works under a similar license.
Per- and polyfluoroalkyl substances (PFAS) are synthetic chemicals known for their persistence and potential health hazards. Notably, perfluorooctane sulfonic acid (PFOS) and perfluorooctanoic acid (PFOA) are of particular concern due to their extensive use and environmental impact. Historically, PFOS and PFOA were used in applications such as firefighting foams, stain-resistant treatments, and various industrial processes because of their effective water- and grease-repellent properties (EPA, 2016). The U.S. EPA (2016) estimates that PFOS and PFOA have exceptionally long half-lives in water—over 41 years for PFOS and more than 92 years for PFOA. Their chemical stability suggests that these substances could persist indefinitely in the environment, as they are unlikely to degrade under natural conditions (Blum et al., 2015). This persistence underscores the significant challenges associated with managing and remediating these pollutants.
Problem 4: Decay of PFOA in groundwater
In 2024, the U.S. Environmental Protection Agency (EPA) announced enforceable Maximum Contaminant Levels (MCLs) for perfluorooctanoic acid (PFOA) and perfluorooctane sulfonic acid (PFOS) in drinking water. These MCLs are set at 4.0 nanograms per liter (ng/L), or 4.0 parts per trillion (ppt), for each substance individually. Hepburn et al. (2019) reported that PFOA concentrations in groundwater affected by aqueous film-forming foam (AFFF) in the U.S. can reach up to 36,110 ng/L. This stark contrast underscores the significant gap between the proposed regulatory limits and the actual contamination levels observed in some affected areas. Using the dataset below, determine the equation that defines the relationship between the years after AFFF impacted groundwater and PFOA concentration. Then, determine how many years after the impact of AFFF before groundwater reaches the MCL level of 4.0 ng/l.
The half-life The time it takes for half of a sample to decay. The "parent" is the starting material, which decays to the "daughter" material. In one half-life, there will be 50% remaining of parent and 50% of daughter. After two half-lives, there would be 25% of parent left and 75% of the sample would now be daughter. of the decay process of PFOA in groundwater is about 92 years. The table below shows PFOA concentrations of AFFF impacted groundwater over time.
Here are the data:
| Years after AFFF impact |
PFOA Concentration (ng/l) |
| 1 |
36110 |
| 93 |
18055 |
| 185 |
9027.5 |
| 277 |
4513.75 |
| 369 |
2256.88 |
| 461 |
1128.44 |
| 553 |
564.22 |
| 645 |
282.11 |
| 737 |
141.05 |
| 829 |
70.53 |
| 921 |
35.26 |
| 1013 |
17.63 |
| 1105 |
8.82 |
The first column is the years after AFFF contamination in groundwater. The second column, PFOA concentration in groundwater, is given in ng/l, which is nanograms per liter.
Step 1: EVALUATE the data to assess the ranges of the variables.
We can use the units of ng/l as it is. Note that the amount goes from more than 30,000 to less than 10. That is five orders of magnitude. Additionally, the time (staying with year for units) of the samples ranges from a high of 1,105 to a low of 1, three orders of magnitude. Time is the independent variable, so we will put it on the x-axis. This makes the PFOA concentration the dependent variable and on the y-axis.
This presents us with a great opportunity to use a Log-Log plot!
Step 2: CREATE an x-y scatter plot of the data.
Refer to previous examples of creating Excel plots or find other resources by searching user forums, YouTube, or other web or reference sources. Remember, getting better at Excel, or spreadsheet programs in general, will make you a better student and scientist.
- Copy the table above into Excel. The program USUALLY (not always) will recognize tabular data and separate it into rows and columns.
- Put your cursor in a cell that DOES NOT have any data. Use the "Insert" tab and select "Scatter (X-Y)" under Charts. This will bring up a blank chart, or a weird-looking one, or even a correct one! We'll want to start from a blank chart.
- Choose "Select Data." If Excel opened the chart and it looks wrong remove any of the "Series" that are in the window for Legend Entries to get to a blank chart. If Excel opened the chart as blank, you're ready for the next step.
- Choose to Add a Series in the Select Data window. A new window will pop up with three boxes. In the first box for Series Name, type "PFOA Concentration." Click the icon at the end of the third box for Series Y values to allow you to choose your y-axis data, in this case the 'PFOA concentration (ng/l)' from the third column. Click the icon at the end of the second box for Series X values to allow you to choose your x-axis data, in this case the 'Years after AFFF impact (years)' from the second column.
- Click OK for the Edit Series and then for the Select Data windows. Now that your data is in the graph, it is time to manipulate the axes based on your determination that this should be a Log-log plot. Right-click the y-axis, and select "Format Axis." Under Axis Options, click the radio button for Logarithmic scale (leave the Base as 10). Right-click on the y-axis on the chart. Choose to "Add Minor Gridlines." Repeat the process for the x-axis.
At this point, you have created your Excel plot and it's time to move on to Step 3, adding the trendline. Here is what the graph would look like after a few aesthetic changes for presentation purposes.

PFOA concentration graph with log axes
Provenance: Rory McFadden, Carleton College
Reuse: This item is offered under a Creative Commons Attribution-NonCommercial-ShareAlike license http://creativecommons.org/licenses/by-nc-sa/3.0/ You may reuse this item for non-commercial purposes as long as you provide attribution and offer any derivative works under a similar license.
Step 3: Add a TRENDLINE to the graph.
In the chart area, hover over one of the data points. Right-click your mouse and choose to "Add Trendline."
In the Format Trendline window, choose the best option that fits your data. In this case, you may recognize that the "Exponential" function is the best one this time. Click the radio button to "Display Equation on Chart."
Here is the final chart with the trendline and the equation that represents the PFOA concentration curve.

PFOA concentration with trendline and equation
Provenance: Rory McFadden, Carleton College
Reuse: This item is offered under a Creative Commons Attribution-NonCommercial-ShareAlike license http://creativecommons.org/licenses/by-nc-sa/3.0/ You may reuse this item for non-commercial purposes as long as you provide attribution and offer any derivative works under a similar license.
The relationship is $y=36382e^{-0.008x}$. This means that we can determine the PFOA concentration (y) based on determining the number of years after AFFF impact (x).
Step 4: ANALYZE the graph to determine the relationship between variables.
We've determined the answer to the first question, what is the equation for the PFOA concentration, as
$y=36382e^{-0.008x}$
The second question asked how many years after AFFF impact before PFOA concentration would drop below 4 ng/l, the maximum contaminant level of PFOA for enforcement?
$y=36382e^{-0.008x}$
Rearrange the equation to move 'x' out of the exponent position using natural log (ln):
First, divide both sides by 36,382:
$\frac{y}{36382}=ln{e^{-0.008x}}$
$ln\frac{y}{36382}=ln{e^{-0.008x}}$, which simplifies to:
$ln\frac{y}{36382}=-0.008x$, insert y-value and solve for x
$ln\frac{4}{36382}=-0.008x$
$-9.116=-0.008x$, divide both sides by -0.008
$\frac{-9.116}{-0.008}=x$
$x=1,139.44$
The answer is 1,139.44 years. Does that make sense with the data and trendline on your chart?
References:
- Blum, A., Dyke, A., & Pfohl, R. (2015). The Uncertain Future of PFOS and PFOA: Implications for Environmental Management. Environmental Science & Technology, 49(21), 12716-12723.
- Hepburn, E., Madden, C., Szabo, D., Coggan, T. L., Clarke, B., & Currell, M. (2019). Contamination of groundwater with per- and polyfluoroalkyl substances (PFAS) from legacy landfills in an urban redevelopment precinct. Environmental Pollution, 248, 101-113. https://doi.org/10.1016/j.envpol.2019.02.018
- U.S. Environmental Protection Agency (EPA). (2016). Fact Sheet: PFOA & PFOS Drinking Water Health Advisories. Retrieved from https://www.epa.gov/sdwa/past-pfoa-and-pfos-health-effects-science-documents
- U.S. Environmental Protection Agency (EPA). (2024). EPA Announces Enforceable Limits for PFAS in Drinking Water. Retrieved from https://www.epa.gov/sdwa/and-polyfluoroalkyl-substances-pfas
Next steps
TAKE THE QUIZ!!
I think I'm competent with log-log plots and I am ready to take the quiz! This link takes you to WAMAP. If your instructor has not given you instructions about WAMAP, you may not have to take the quiz.Or you can go back to the Log Plots explanation page.