Initial Publication Date: August 16, 2024
DOIThis page currently has no DOI, but you may request a DOI be assigned. |
Cite thisCorrelation - Practice Problems
Solving Earth Science problems using r2 values
This module is undergoing classroom implementation with the Math Your Earth Science Majors Need project. The module is available for public use, but it will likely be revised after classroom testing.
Conceptual Understanding
The first two problems on this practice problems page focus on examining the strength and direction of the relationship between the two variables, x and y.
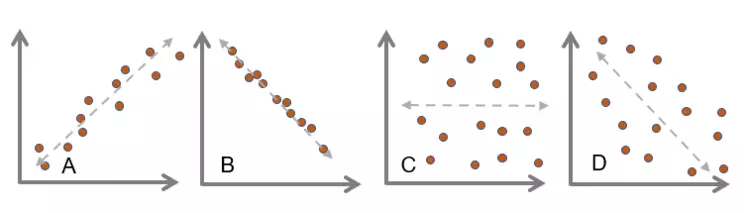
Problem 1: Assume the following scatter plots display data from different rivers around the world. The x-axis represents river width (m) and the y-axis represents river depth (m). Order the following river width vs. depth scatter plots from the weakest correlation to the strongest correlation.
Scatter plots with a range of correlation
![[creative commons]](/images/creativecommons_16.png)
Provenance: Rory McFadden, Carleton College
Reuse: This item is offered under a Creative Commons Attribution-NonCommercial-ShareAlike license http://creativecommons.org/licenses/by-nc-sa/3.0/ You may reuse this item for non-commercial purposes as long as you provide attribution and offer any derivative works under a similar license.
Step 1: Identify two variables - skip for this question
Step 2: Assign variables to x and y - this is already done for this question
Step 3: Create a scatter plot and visually identify the strength and direction of the relationship between the variables.
For this problem, the scatter plots have been created for you, and you are asked to assess the strength of the relationship (how close the data points are to the linear regression line), part of step 3 on the example problems page. The scatter plot with the weakest (large scatter from the line) correlation is C. Then, D, A, and B have increasing strength of correlation because their data points are closer to the linear regression line.
Step 4: Add a linear regression line and r2 - skip this step for this question.
Step 5: Describe what the r2 value means in a geologic context - skip this step for this question.
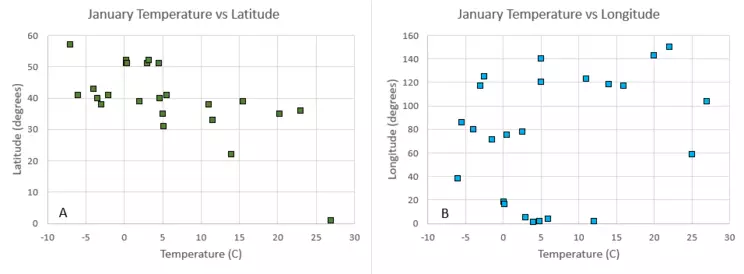
Temperature vs latitude scatter plot and temperature vs. longitude scatter plot
Provenance: Rory McFadden, Carleton College
Reuse: This item is offered under a Creative Commons Attribution-NonCommercial-ShareAlike license http://creativecommons.org/licenses/by-nc-sa/3.0/ You may reuse this item for non-commercial purposes as long as you provide attribution and offer any derivative works under a similar license.
Problem 2: We have experienced how air temperature can change based on where you are in the world and also the time of year, but how correlated are winter temperatures and distance from the equator (latitude)? Or distance from Greenwich, England (longitude)? In the figure below, what is the direction of the correlation between January temperature and latitude (0° is the equator)? In comparison to January temperature and longitude, what is the strength (stronger, weaker, or no correlation) of the correlation between January temperature and latitude (0° is the equator)?
Step 1: Identify two variables - this is already done for this questions
Step 2: Assign variables to x and y - this is already done for this question
Step 3: Create a scatter plot of the data and visually identify the strength and direction of the relationship between the variables.
For this problem, the scatter plot has been created for you. But now, to answer the question! In order to determine the direction of the relationship, it's easiest to look at the best fit line. Is it sloping upwards as you move to the right (positive) or downwards as you move to the right (negative)? However, this example doesn't have a line, so what should you do? You can first try to imagine where the best fit line would be, and then check by seeing if the y-values generally increase as you move to the right, or decrease. In this case, they decrease, so the relationship would be negative. Next, is to determine the strength of the relationship in comparison to the January temperature vs longitude plot. When we have a r2 value, this is very straightforward, but what should we do when we don't have a r2 value? Again, we try to imagine where the best fit line would be and if data points would land really close to that line, or if there is a lot of spread in those data points. In this case, the points would land closer to the line in temperature vs latitude than in temperature vs longitude, so the correlation between temperature and latitude would be stronger than temperature vs longitude.
Step 4: Add a linear regression line and r2 value to your plot using Excel - you can skip this step for this problem.
Step 5: Describe what the r2 value means in its geological context.
For this problem, you would not need to complete this step. However, you could have already determined the qualitative strength and the direction of the relationship, so you could actually answer this question! In this example, the January temperature is more strongly correlated with latitude (distance from the equator) than distance from Greenwich, England. Additionally, the January temperature decreases as you move farther away from the equator.
Diving into data sets
The next couple problems include small datasets of geoscience phenomena for you to practice assessing the relationship between two variables and calculating r2.

stream in a forest
Provenance: Laura Reynolds, Worcester State University
Reuse: This item is offered under a Creative Commons Attribution-NonCommercial-ShareAlike license http://creativecommons.org/licenses/by-nc-sa/3.0/ You may reuse this item for non-commercial purposes as long as you provide attribution and offer any derivative works under a similar license.
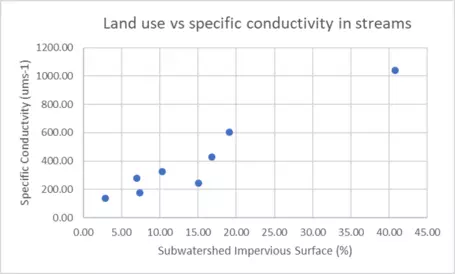
Problem 3: In many urban areas in the Northeastern United States, stream water specific conductivity (a temperature-standardized measure of the dissolved ions, including salts, in water) has been increasing over time, likely as a result of increased salt use on winter roads. In this example, we will test the hypothesis that specific conductivity values can be explained by the relationship between conductivity values and land use in the watershed (percent impervious surface in the watershed) by answering the following question: Given the data below, what percent of the variation in specific conductivity can be explained by the linear relationship between conductivity and percent impervious surface in the watershed?
24x tmyn pp spc data.csv| site | percent_developed | specific_conductivity |
|---|
| 1 | 7.37 | 176.42 |
|---|
| 2 | 2.85 | 138.75 |
|---|
| 3 | 15.07 | 243.95 |
|---|
| 4 | 19.12 | 605.45 |
|---|
| 5 | 7.02 | 278.86 |
|---|
| 6 | 40.74 | 1038.53 |
|---|
| 7 | 16.78 | 426.79 |
|---|
| 8 | 10.29 | 325.45 |
|---|
Download data (175bytes)
(last updated 2024-06-04 15:45:24)
Step 1: Identify two variables you want to compare from a dataset to determine whether they are related.
In this example, we have a series of sites with average conductivity values and watershed land use values. We want to compare the land use vs conductivity data for each site.
Step 2: Assign variables to x (independent variable) and y (dependent variable).
Because we are hypothesizing that the conductivity values will depend on the land use in the watershed, the percent impervious surface will be our independent (x) value and the specific conductivity will be our dependent (y) value.
Step 3: Create a scatter plot of the data and visually identify the strength and direction of the relationship between the variables.
Enter the data into Excel. Create the scatter plot.
Select both columns of your data. In the Excel menu, click on "Insert" and then the chart feature and select the scatter option (with no connecting lines). In the resulting chart, click the chart area to display the Chart Design and Format tabs in the top menu. Update the chart title, axis labels, and more.
Examine the scatter plot and identify the strength and direction of the correlations between land use and specific conductivity.
Provenance: Laura Reynolds, Worcester State University
Reuse: This item is offered under a Creative Commons Attribution-NonCommercial-ShareAlike license http://creativecommons.org/licenses/by-nc-sa/3.0/ You may reuse this item for non-commercial purposes as long as you provide attribution and offer any derivative works under a similar license.
The scatter plot shows a strong positive correlation between the two variables, meaning sites with higher percentages of impervious surface in the watershed tend to have higher conductivity values.
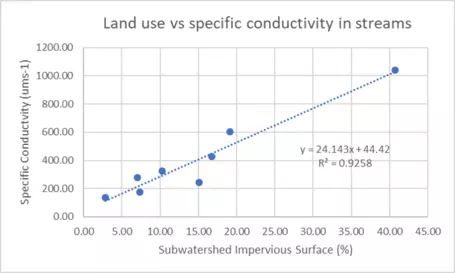
Step 4: Add a linear regression line and r2 value to your plot using Excel.
Select the chart area again. Click on "Chart Design" then "Add Chart Element." Select Trendline --> Linear. Then check the boxes for "Display equation on chart" and "Display r-squared value on chart."
Provenance: Laura Reynolds, Worcester State University
Reuse: This item is offered under a Creative Commons Attribution-NonCommercial-ShareAlike license http://creativecommons.org/licenses/by-nc-sa/3.0/ You may reuse this item for non-commercial purposes as long as you provide attribution and offer any derivative works under a similar license.
Step 5: Describe what the r2 value means in its geological context.
The r2 value for this example is 0.9258, meaning that ~93% of the variation in specific conductivity can be explained by the linear regression between conductivity and % impervious surface. Therefore, conductivity is strongly correlated with land use, and this would be a relationship that would be interesting to examine in more detail for causality.
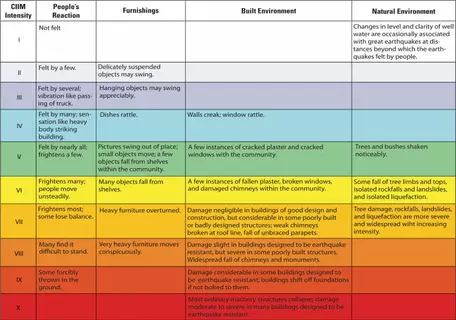
USGS Modified Mercalli Intensity(MMI) Scale
![[reuse info]](/images/information_16.png)
Provenance: from USGS: https://volcanoes.usgs.gov/observatories/hvo/felt_earthquakes.html
Reuse: This item is in the public domain and maybe reused freely without restriction.
Problem 4: The magnitude, location, and depth of an earthquake (and overlying soil conditions!) all determine how widely and strongly any particular earthquake can be felt, but what is the relationship between those variables and what we feel on the surface? Specifically, use the table below to first plot the amount of shaking and the depth of the hypocenter, then calculate the r2 value, and lastly, describe the relationship between the amount of shaking felt at the surface and the depth of an earthquake hypocenter. In this example, we will look at all magnitude 6.1 earthquakes that occurred between 1/1/2024 and 6/1/2024. To quantify the amount of shaking, we will use the USGS Modified Mercalli Intensity (MMI) Scale, which assigns intensities as Roman numerals and is based on observed effects.
EQK_example.csv| Region | Depth (km) | Shaking felt (MMI scale) |
|---|
| Pagan Region, Northern Mariana Islands | 184 | 4 |
|---|
| Taxisco, Guatemala | 90 | 5 |
|---|
| Kermadec Islands, New Zealand | 13 | 4 |
|---|
| Minami-sōma, Japan | 29 | 4 |
|---|
| Hualien City, Taiwan | 9 | 7 |
|---|
| Hualien City, Taiwan | 10 | 8 |
|---|
| Banjar, Indonesia | 55 | 5 |
|---|
| Fakfak, Indonesia | 13 | 6 |
|---|
| Luganville, Vanuatu | 40 | 6 |
|---|
Download data (323bytes)
(last updated 2024-06-21 07:57:20)
Step 1: Identify two variables you want to compare from a dataset to determine whether they are related.
In this example, we have a series of sites that had magnitude 6.1 earthquakes in the past. For each magnitude 6.1 earthquake listed, we have its location, depth, and shaking felt near the surface. We want to compare the earthquake depth vs. shaking data for each site.
Step 2: Assign variables to x (independent variable) and y (dependent variable).
Because we are hypothesizing that the shaking felt at the surface will at least in part depend on the depth of the earthquake, earthquake depth will be our independent (x) value and the surface shaking will be our dependent (y) value.
Step 3: Create a scatter plot of the data and visually identify the strength and direction of the relationship between the variables.
Enter the data into Excel. Create the scatter plot.
Select both columns of your data. In the Excel menu, click on "Insert" and then the chart feature and select the scatter option (with no connecting lines). In the resulting chart, click the chart area to display the Chart Design and Format tabs in the top menu. Update the chart title, axis labels, and more.
Examine the scatter plot and identify the strength and direction of the correlations between earthquake depth and ground shaking level.
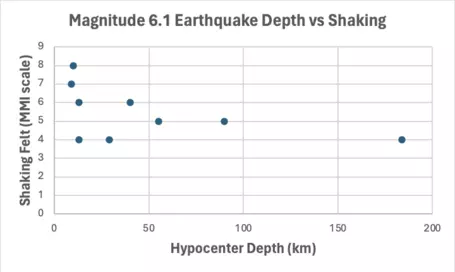
Provenance: Kristin Schild, University of Maine
Reuse: This item is offered under a Creative Commons Attribution-NonCommercial-ShareAlike license http://creativecommons.org/licenses/by-nc-sa/3.0/ You may reuse this item for non-commercial purposes as long as you provide attribution and offer any derivative works under a similar license.
The scatter plot shows a weak negative correlation between the two variables, meaning deeper earthquakes tend to be associated with lower ground shaking levels, but there is a lot of scatter in the data especially for shallow earthquakes.
Step 4: Add a linear regression line and r2 value to your plot using Excel.
Select the chart area again. Click on "Chart Design" then "Add Chart Element." Select Trendline → Linear. Then check the boxes for "Display equation on chart" and "Display r-squared value on chart."

Provenance: Kristin Schild, University of Maine
Reuse: This item is offered under a Creative Commons Attribution-NonCommercial-ShareAlike license http://creativecommons.org/licenses/by-nc-sa/3.0/ You may reuse this item for non-commercial purposes as long as you provide attribution and offer any derivative works under a similar license.
Step 5: Describe what the r2 value means in its geological context.
The r2 value for this example is 0.2444, meaning that ~24% of the variation in the shaking level can be explained by the linear regression between earthquake depth and shaking level. Therefore, shaking level is weakly correlated with earthquake depth; there are likely other factors on which shaking level depends more strongly. It's also important to note that we only had a few data points for deep earthquakes-- including additional data over a wider range of earthquake depths may provide additional information.
Problem 5: The geochemistry of igneous rocks can often give us interesting information about the geological history and magmatic processes of a volcanic region. In this example, from Chen et al. (2020), the amount of lithium in a volcanic sample is interpreted to represent increased changes in magma composition. Use the provided data, create a scatter plot, and answer the following question: What does the r2 value tell you about the relationship between crustal thickness and lithium content of magma?
Crust_thickness_Li_dataset.csv| Li (ppm) | Crustal Thickness (km) |
|---|
| 6.4 | 18 |
|---|
| 5.8 | 19 |
|---|
| 4.6 | 27 |
|---|
| 6.1 | 28 |
|---|
| 5.9 | 30 |
|---|
| 8 | 35 |
|---|
| 7.4 | 39 |
|---|
| 8.8 | 38 |
|---|
| 9 | 41 |
|---|
Crust_thickness_Li_dataset from Chen et al. 2020
Download data (101bytes)
(last updated 2024-08-14 15:39:44)
Step 1: Identify two variables you want to compare from a dataset to determine whether they are related.
In this example, we want to compare crustal thickness and lithium (Li) concentration in ppm.
Step 2: Assign the x (independent variable) and y (dependent variable) variables.
In the graph, the x variable is crustal thickness and the y variable is the lithium concentration in parts per million. When we interpret the relationship between these two variables, we will be trying to determine the degree to which the crustal thickness explains the variation in the linear relationship between crustal thickness and lithium concentration.
Step 3: Create a scatter plot of the data and visually identify the strength and direction of the relationship between the variables.
Enter the data into Excel. Create the scatter plot.
Select both columns of your data. In the Excel menu, click on "Insert" and then the chart feature and select the scatter option (with no connecting lines). In the resulting chart, click the chart area to display the Chart Design and Format tabs in the top menu. Update the chart title, axis labels, and more.
Examine the scatter plot and identify the strength and direction of the correlations between crustal thickness and Li ppm.
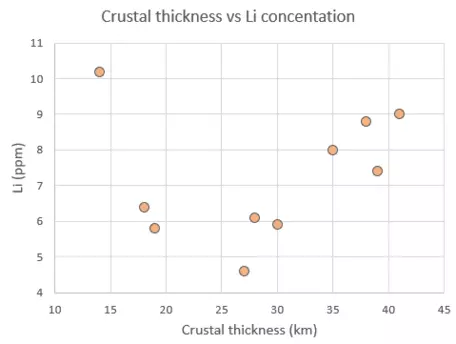
Crustal thickness vs Li ppm scatter plot
Provenance: Rory McFadden, Carleton College
Reuse: This item is offered under a Creative Commons Attribution-NonCommercial-ShareAlike license http://creativecommons.org/licenses/by-nc-sa/3.0/ You may reuse this item for non-commercial purposes as long as you provide attribution and offer any derivative works under a similar license.
The scatter plot shows a moderate positive correlation between the two variables, meaning crustal thickness tends to be associated with higher Li ppm.
Step 4: Add a linear regression line and r2 value to your plot using Excel.
Select the chart area again. Click on "Chart Design" then "Add Chart Element." Select Trendline → Linear. Then check the boxes for "Display equation on chart" and "Display r-squared value on chart."
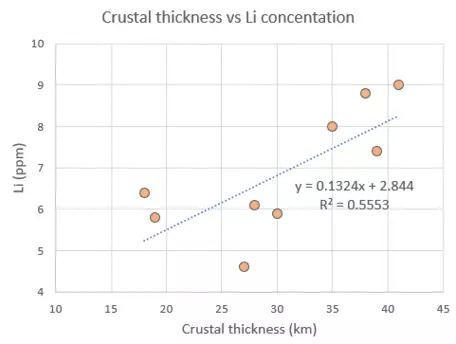
Crustal thickness vs Li ppm scatter plot with trendline and equation
Provenance: Rory McFadden, Carleton College
Reuse: This item is offered under a Creative Commons Attribution-NonCommercial-ShareAlike license http://creativecommons.org/licenses/by-nc-sa/3.0/ You may reuse this item for non-commercial purposes as long as you provide attribution and offer any derivative works under a similar license.
Step 5: Describe what the r2 value means in its geological context.
The r2 value rounds to 0.56. This means that 56% of the variation in lithium content can be explained by the linear regression of lithium concentration on crustal thickness. Based on the direction of the linear regression in the plot (positive), we can say that the two variables are positively correlated.
Next steps
TAKE THE QUIZ!!
I think I'm competent with correlation and I am ready to take the quiz! This link takes you to WAMAP. If your instructor has not given you instructions about WAMAP, you may not have to take the quiz.Or you can go back to the Correlation explanation page.