Initial Publication Date: May 1, 2010
Week 11: Using Satellite Data to Investigate Deforestation
On this page
Using ImageJ to Detect Change
Download Images of Deforestation
Launch ImageJ and Import the Images as a Stack
Animate and Explore the Stack to Observe Changes Over Time
Process the Stack for Analysis
Measure the Area of Deforestation Each Year
Create an RGB Color Image from the Stack
Interpret Your Results
Download Images of Deforestation
Launch ImageJ and Import the Images as a Stack
Animate and Explore the Stack to Observe Changes Over Time
Process the Stack for Analysis
Measure the Area of Deforestation Each Year
Create an RGB Color Image from the Stack
Interpret Your Results
Using ImageJ to Detect Change
Investigation questions:
- How has deforestation in the Amazon rainforest changed over time?
- What is the pattern of deforestation? Which areas were cleared first, later, and most recently?
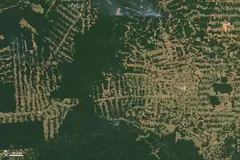
One of the most deforested parts of the Amazon rainforest lies within the state of Rondonia in Brazil. The loss of the rainforest is primarily due to human activities such as raising crops and livestock. Unfortunately, although these activities have short-term benefits to people, over time, the loss of the rainforest can lead to the extinction of plants and animals as well as contribute to global climate change.
top of pageDownload Images of Deforestation
Download three images of deforestation to your Week 11 folder or directory. These images show deforestation in the Amazon rainforest during the years 2001, 2005, and 2009.- Click the thumbnail image below to open a full-size version in a separate window. Then right-click (Win) or control-click (Mac) the full-size image to choose File > Save Image As... and save it to your Week 11 folder. Close the image window after you have downloaded its file.
top of page
Launch ImageJ and Import the Images as a Stack
- Launch ImageJ by double-clicking its icon
 on your desktop or by clicking its icon in the dock (Mac) or Launch Bar (Win).
 - Import the three images into ImageJ as a stack. top of page
- Click and drag the scroll bar at the bottom of the stack window to move forward and backward through the stack. You can also use the Next Slice (>) and Previous Slice ( keyboard shortcuts to move forward and backward through the stack.
- Choose Image > Stacks > Start Animation [\] to watch the stack play as a movie.

- Carefully observe the images in the stack. Notice the areas where trees have been cleared along with the position of smoke plumes.
- Based on your observations, between which years do you think the greatest deforestation occurred?
- Set a scale for the images in the stack.
- Save the stack as Amazon.tif so that you can reopen a "clean" copy of it later.
- Convert the color stack to 8-bit grayscale stack.
- Make the stack binary.
- This is what the stack looks like when converted to binary format. The cleared areas are white, while the forested areas are black.
 top of page
- Use the Threshold feature to highlight all the white pixels in red.
- Select the measurements that will be recorded in the Results window.
- Measure the area of deforestation on each slice of the stack (all three images). top of page
- This what the resulting RGB color image looks like.

- Open up the Amazon.tif stack that you saved earlier. Compare the RGB color image with the stack of original images. Animate the stack as needed to help you understand the colors in the RGB image.
- Make the 3-slice binary stack active again by clicking on it. The deforested areas appear as bright white in each slice of the stack.
- Arrange the binary stack and the RGB color image so that you can see both side by side.
- The RGB color image you created is a combination of three individual images that are displayed in three primary colors. Notice that in the RGB image, the four most prominent colors are black, white, cyan and blue.
Given how primary colors add together, what is your interpretation of what the colors mean on the RGB image?
Animate and Explore the Stack to Observe Change Over Time
You can step through a stack one slice at a time, or you can animate it like a repeating movie loop.
Process the Stack for Analysis
Measure the Area of Deforestation Each Year
Create an RGB Color Image from the Stack
top of pageInterpret Results
To understand what each color on this final image means, reexamine the figure below. Remember the concept of additive colors; red, green and blue are the three primary colors which together add up to make white.


