Part 1: Use Images to Analyze How Lake Mead Has Changed Over Time2
Drought in the Desert — Water and Energy for a Thirsty Southwest
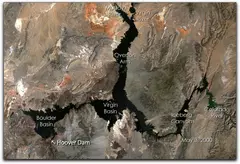
Except for some coastal areas, the southwestern United States is mostly desert — beautiful in it own way, but dry and inhospitable. In the early 1920s, the southwestern states realized that they needed to plan for the water and energy needs of their rapidly expanding population and for agricultural development. The Bureau of Reclamation began making plans to build a series of dams along the Colorado River to store water and generate electricity.
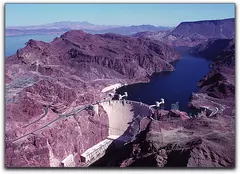
The Bureau began the construction of Boulder Dam, later renamed Hoover Dam, in 1931. The dam was completed in 1936 and soon formed one of the world's largest reservoirs, Lake Mead. Over 97% of the water that flows into Lake Mead comes from rain and snowfall in the Colorado River watershed of the Western Rocky Mountains. Historical records show that patterns of severe drought frequently strike this region.
As the graph below shows, the water level of the lake has fallen dramatically since 2003. Today, a visit to Lake Mead and Hoover Dam shows a lake surface far below the high water mark, surrounded by a broad, white "bathtub ring" of mineral deposits left along the shoreline by the retreating water. As of January 2010, the elevation of the lake surface has dropped by over 130 feet, and the lake is at 44% capacity. Planners project that if the drought continues, the dam will eventually be incapable of generating a reliable supply of electricity. Communities that depend on the water and power supplied by the lake will be forced to look elsewhere for these important resources.
- To learn more about the effects of the drought on Lake Mead and the people who depend on it, read this 2003 NASA Earth Observatory article.
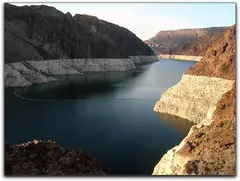 Lake Mead in recent years. Notice the white coating on the rock. The line is what is known as the "bathtub ring".
Investigation questions:
- How has the surface area of Lake Mead changed over time?
- How has the water level in Lake Mead changed over time?
Lake Mead was created to store water for agricultural and domestic use, as well as to generate electricity. It has also become an important recreational resource — in 1964 Lake Mead became our country's first National Recreation Area. As the water level drops, all of these uses are affected.
Lakes are 3-dimensional features — kind of like upside-down mountains. As the water level drops, the volume of the lake decreases dramatically. As of January 2010, the lake was at only 44% of capacity. To get a real sense of how the water level of Lake Mead has changed in recent years, and what this means in terms of the volume of water lost, we need to view the lake from two different perspectives — from above to get a sense of the change in surface area, and from the ground to measure the change in elevation (depth).
Download and Open Images
You're going to use a pair of high resolution Landsat images — one taken in May 2000 and the other in May 2004 — to measure changes in the surface area of the lake.
- Download the image below by right-clicking (Win) or control-clicking (Mac) on the link and saving the linked file to your Day 5 directory or folder.
lake_mead_2000.tif (TIFF 2.9MB Jan27 10) - Download the image below by right-clicking (Win) or control-clicking (Mac) on the link and saving the linked file to your Day 5 directory or folder.
lake_mead_2004.tif (TIFF 2.9MB Jan27 10) - Launch ImageJ
 , choose File > Open, navigate to your Day 5 folder, and open the lake_mead_2000.tif image.
 - Then open the lake_mead_2004.tif image.
Make a Visual Comparison
These true color satellite images show the exact same view of Lake Mead, four years apart. Slight color differences between the two images are mostly due to differences in atmospheric conditions on the two dates.
Another way to compare the images is to display both images in the same window and flip back and forth between them. In ImageJ a window containing multiple images is called a stack, and the individual images are called slices. Stacking images is a useful way to look at images that show change over time. In addition to flipping through images, you can also animate them.
- Create a stack — To combine the two images into a stack, choose Image > Stacks > Images to Stack.
- Animate the stack — Use the right and left arrow keys or the scroll bar at the bottom of the stack to flip back and forth between the two images. Note: Some color differences of the lake itself are due to actual changes in the lake, others are due to atmospheric effects.
What are the main differences you see between the images of the lake on the two dates? Look for specific features in and around the lake that change dramatically. Think about how these changes affect both people and wildlife.
Select What You Want to Measure
You are interested in measuring the surface area of the lake. You'll also need to measure straight line distances when setting the scale.
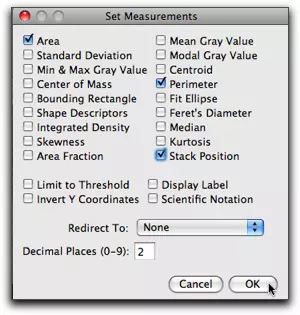
- Choose Analyze > Set Measurements....
- In the Set Measurements dialog box, check the Area and Perimeter (length) options. Since you are working with a stack, check the Stack Position option, then click OK.
Set the Scale
Now you'll set the scale on these images using the distance you measured between the two islands. One reason for stacking the two images is that setting the scale for one image in a stack automatically sets the scale for the others.
- Use the arrow keys on your keyboard to flip to slice 2 of the stack. This slice is labeled 2/2 in the image window status bar.
- Use the Straight line selection tool
 to select the distance between the two islands.
 - Choose Analyze > Set Scale.... Enter 25.4 for the Known Distance, km for the Units of Length, and click OK.
The scale is now set for both the 2000 and 2004 images.
- Measure — Practice measuring a few distances and areas on the images and see if they look reasonable.
- Add a scale bar — Flip to the first slice (the 2000 image), choose Analyze > Tools > Scale Bar... and add a scale bar to the image. Flip to the second slice and add an identical scale bar to the 2004 image.
- Save the stack — Choose File > Save As... and save the stack to your Day 5 folder in TIFF format.
- If you had difficulty saving the stack or you can't find it, right-click (Win) or control-click (Mac) to download a copy to your Day 5 folder, then open it. lake_mead_stack_scale.tif (TIFF 5.7MB Jan31 10)
Select a Region of Interest to Measure
In this investigation, the region of interest is the lake. To measure the area of the lake, you need to select or highlight it in some way. There are many ways to do this. In your own investigations, you may need to experiment with different techniques until you find the one that works best for you. Using the selection tools to outline the lake would be tedious and probably wildly inaccurate.
The key question is: What is it about the lake that makes it stand out from what isn't lake in the image? The color? The brightness? The water in these images appears much darker than the land. ImageJ has tools that can use these differences to highlight and select just the lake.
Specifically, you're going to use the Wand (tracing) tool ![]() to select the pixels that represent water. When you click on the image with this tool, ImageJ selects all of the pixels within a contiguous area - touching each other - that have values within a specified range, called the tolerance. For example, if the pixel you click on has a value of 25 and the tolerance is set to 20, all adjacent pixels with values from 5 to 45 would be selected. Using this tool takes a little practice, but you should get the hang of it quickly.
to select the pixels that represent water. When you click on the image with this tool, ImageJ selects all of the pixels within a contiguous area - touching each other - that have values within a specified range, called the tolerance. For example, if the pixel you click on has a value of 25 and the tolerance is set to 20, all adjacent pixels with values from 5 to 45 would be selected. Using this tool takes a little practice, but you should get the hang of it quickly.
- Flip to the first slice - the image of the lake in 2000.
- To set the tolerance, double-click the Wand (tracing) tool
 to open the Wand Tool window and set the Tolerance to 20. For now, leave the mode set to Legacy and click OK.
 - Using the Wand (tracing) tool
 , click anywhere on the lake. The selected pixels will be outlined in yellow. If your first click with the wand doesn't highlight all of the lake (and just the lake), hold down the shift key and click in each of the areas you want to add to your selection. If you select too much or the wrong area, choose Edit > Selection > Select None and start over.
Measure the Region of Interest
- Choose Analyze > Measure. The surface area of the lake, in square kilometers, will be reported in the Results window.
- Flip to the second slice of the stack showing Lake Mead 2004.
The yellow selection outline is still visible, showing the shoreline of the lake in 2000 superimposed on the 2004 image. This is another technique for making visual comparisons. You don't want to do it now, but you could draw this outline on the image to make it permanent.
- Choose Edit > Selection > Select None to remove the 2000 outline, then repeat the process using the Wand (tracing) tool
 to outline and measure the surface area of the lake in 2004.
You have measured the surface area of Lake Mead in 2000 and 2004. Write down your results or print out the ImageJ Results window. (Or, you could export it as spreadsheet data, but that seems overkill with just two areas.) To estimate the volume of the water lost over this four year period, you need to know the change in elevation of the lake surface that corresponds to this time interval.
Quantify the Change in Depth
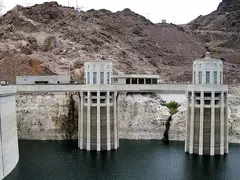
Ground-based images often complement the views we get through our eyes in the sky. To determine the change in the elevation of the lake, we'll use good old-fashioned snapshots of Lake Mead.
Hoover Dam was completed in 1936 and continues to be a popular and scenic tourist stop. Visible in almost every tourist snapshot of the dam and the lake behind it are one or more of four white concrete structures, connected to the dam by concrete walkways. These are the very tops of four huge water intake towers that feed lake water to the electric generators below the dam.
- Click the thumbnail at right to open a larger version of the image, right-click (Win) or control-click (Mac) on the large image, and save it to your Week 2 folder.
- Open the hoover_dam_intake_10_26_2004.jpg image in ImageJ.
This image shows the two intake towers on the Nevada side of the dam. You will use the information about these towers to set the scale for measuring the water elevation.
- Using the Straight line selection tool
 , measure the diameter across the top of either intake tower.
 - Choose Analyze > Set Scale... and enter the known diameter of 48 feet.
The same can't be said for photographs like this one. The features in the image are at different distances from the camera. When you set a scale on an image, it is only meaningful for features at one distance. Be sure to use the same intake tower for setting the scale and measuring the distance from the high water mark (the bottom of the walkway) to the lake surface.
- Using the Straight line selection tool
 , measure the distance from the bottom of the concrete walkway straight down to the water surface below that point.
 - Here are some questions to think about:
- Based on your measurements, what was the elevation of the lake surface in 2004? (Remember, the bottom of the walkway is at an elevation of 1226 feet above sea level.
- To complete this investigation, what kind of image would you need to estimate the total loss of water between 2000 and 2004?
- How could you employ ground-based photography or other "ground truthing" methods with your students? Now that you have these two measurements - the loss of surface area and the change in depth - what would you have your students do with them?
To continue the investigation, here is a set of intake tower images from different years, courtesy of the U.S. Bureau of Reclamation. Additional images are available online, but can't be distributed here due to copyright restrictions.
Time-Series Pairs From the Earth Observatory
Aquaculture
http://earthobservatory.nasa.gov/IOTD/view.php?id=6339
Coastal change
http://earthobservatory.nasa.gov/IOTD/view.php?id=6360
Deforestation
http://earthobservatory.nasa.gov/IOTD/view.php?id=8506 http://earthobservatory.nasa.gov/IOTD/view.php?id=6954 http://earthobservatory.nasa.gov/IOTD/view.php?id=6811 http://earthobservatory.nasa.gov/IOTD/view.php?id=6450 http://earthobservatory.nasa.gov/IOTD/view.php?id=5930 http://earthobservatory.nasa.gov/IOTD/view.php?id=3721
Dust, haze, and air pollution
http://earthobservatory.nasa.gov/NaturalHazards/view.php?id=19384 http://earthobservatory.nasa.gov/IOTD/view.php?id=4987 http://earthobservatory.nasa.gov/IOTD/view.php?id=8364
Fires
http://earthobservatory.nasa.gov/IOTD/view.php?id=701
Flooding
http://earthobservatory.nasa.gov/IOTD/view.php?id=8701 http://earthobservatory.nasa.gov/IOTD/view.php?id=8059 http://earthobservatory.nasa.gov/IOTD/view.php?id=7500 http://earthobservatory.nasa.gov/IOTD/view.php?id=6499 http://earthobservatory.nasa.gov/IOTD/view.php?id=6468 http://earthobservatory.nasa.gov/IOTD/view.php?id=6334 http://earthobservatory.nasa.gov/IOTD/view.php?id=5967 http://earthobservatory.nasa.gov/IOTD/view.php?id=5422 http://earthobservatory.nasa.gov/IOTD/view.php?id=5355 http://earthobservatory.nasa.gov/IOTD/view.php?id=5175 http://earthobservatory.nasa.gov/NaturalHazards/view.php?id=4864&eocn=image&eoci=morenh http://earthobservatory.nasa.gov/IOTD/view.php?id=3856 http://earthobservatory.nasa.gov/IOTD/view.php?id=3708 http://earthobservatory.nasa.gov/IOTD/view.php?id=2774
Glacial retreat
http://earthobservatory.nasa.gov/IOTD/view.php?id=8434 http://earthobservatory.nasa.gov/IOTD/view.php?id=6207 http://earthobservatory.nasa.gov/IOTD/view.php?id=4710 http://earthobservatory.nasa.gov/IOTD/view.php?id=3606
Hurricanes
http://earthobservatory.nasa.gov/IOTD/view.php?id=5822 http://earthobservatory.nasa.gov/IOTD/view.php?id=5811 http://earthobservatory.nasa.gov/IOTD/view.php?id=3815
Ice shelves & sea ice
http://earthobservatory.nasa.gov/IOTD/view.php?id=7282 http://earthobservatory.nasa.gov/IOTD/view.php?id=3898 http://earthobservatory.nasa.gov/IOTD/view.php?id=3138
Invasive species/water plants
http://earthobservatory.nasa.gov/IOTD/view.php?id=8065 http://earthobservatory.nasa.gov/IOTD/view.php?id=7761
Lakes
http://earthobservatory.nasa.gov/IOTD/view.php?id=7845 http://earthobservatory.nasa.gov/IOTD/view.php?id=7645 http://earthobservatory.nasa.gov/IOTD/view.php?id=7615 http://earthobservatory.nasa.gov/IOTD/view.php?id=7341 http://earthobservatory.nasa.gov/IOTD/view.php?id=5713 http://earthobservatory.nasa.gov/IOTD/view.php?id=5506
Landslide
http://earthobservatory.nasa.gov/IOTD/view.php?id=5984 http://earthobservatory.nasa.gov/IOTD/view.php?id=4798 http://earthobservatory.nasa.gov/IOTD/view.php?id=2843
Mining
http://earthobservatory.nasa.gov/IOTD/view.php?id=2822 http://earthobservatory.nasa.gov/IOTD/view.php?id=8331
Reservoirs
http://earthobservatory.nasa.gov/IOTD/view.php?id=8696 http://earthobservatory.nasa.gov/IOTD/view.php?id=8132 http://earthobservatory.nasa.gov/IOTD/view.php?id=7769 http://earthobservatory.nasa.gov/IOTD/view.php?id=7642 http://earthobservatory.nasa.gov/IOTD/view.php?id=6809 http://earthobservatory.nasa.gov/IOTD/view.php?id=6574 http://earthobservatory.nasa.gov/IOTD/view.php?id=3796 http://earthobservatory.nasa.gov/IOTD/view.php?id=3556
Rivers
http://earthobservatory.nasa.gov/IOTD/view.php?id=6887 http://earthobservatory.nasa.gov/IOTD/view.php?id=6650
Seasonal variability
http://earthobservatory.nasa.gov/IOTD/view.php?id=7714 http://earthobservatory.nasa.gov/IOTD/view.php?id=7497 http://earthobservatory.nasa.gov/IOTD/view.php?id=7082 http://earthobservatory.nasa.gov/IOTD/view.php?id=3416
Snow cover
http://earthobservatory.nasa.gov/IOTD/view.php?id=7842
top of page
Suspended sediment
http://earthobservatory.nasa.gov/IOTD/view.php?id=8103
Tornadoes
http://earthobservatory.nasa.gov/IOTD/view.php?id=7766
Tsunami
http://earthobservatory.nasa.gov/NaturalHazards/view.php?id=5132 http://earthobservatory.nasa.gov/Newsroom/NewImages/images.php3?img_id=16774 http://earthobservatory.nasa.gov/Newsroom/NewImages/images.php3?img_id=16778 http://earthobservatory.nasa.gov/Newsroom/NewImages/images.php3?img_id=16892 http://earthobservatory.nasa.gov/NaturalHazards/view.php?id=5132
Urbanization/human presence
http://earthobservatory.nasa.gov/Newsroom/NewImages/images.php3?img_id=16495 http://earthobservatory.nasa.gov/Newsroom/NewImages/images.php3?img_id=17735 http://earthobservatory.nasa.gov/Newsroom/NewImages/images.php3?img_id=17647 http://earthobservatory.nasa.gov/Newsroom/NewImages/images.php3?img_id=17296 http://earthobservatory.nasa.gov/Newsroom/NewImages/images.php3?img_id=17113
Volcanoes
http://earthobservatory.nasa.gov/Newsroom/NewImages/images.php3?img_id=17555
Time Series Images in World of Change Collection
Your Assignment: Stack, Calibrate, and Animate an Image Set to Investigate Change Over Time
- Browse through one of the two collections above and find a set of images that interests you.
- Download the files to your Day 5 directory or folder and use ImageJ to open, stack, and flip back and forth between the images.
- Use the same process as in the investigation above to set a scale and make measurements on your image.
- Share your results and describe how the features in your image that have changed over time.
- Go to the Part 1: Share and Discuss page and post a montage of the images you used along with your results.
Source
1Adapted from Earth Exploration Toolbook chapter instructions under Creative Commons license Attribution-NonCommercial-ShareAlike 1.0.2Adapted from Eyes in the Sky II online course materials, Copyright 2010, TERC. All rights reserved.
3New material developed for Earth Analysis Techniques, Copyright 2011, TERC. All rights reserved.


