Part 2: Explore and Investigate Multispectral Data2
Working with Multispectral Data in ImageJ
In this section, you will learn how satellites and aircraft use a single black and white camera with colored filters to capture data that can be used to re-create both natural and false color images.
Download Landsat data
Before you begin, you must download a set of seven Landsat images—one image for each of the Landsat Thematic Mapper instrument's 7 bands.
- Create a subfolder in your Day 4 data folder and name it Bolivia.
- Right-click (Win) or control-click (Mac) each of the links below and download each of the following seven TIFF files to the Bolivia folder you created.
- Bolivia-band1.tif (TIFF 869kB May1 10)
- Bolivia-band2.tif (TIFF 869kB May1 10)
- Bolivia-band3.tif (TIFF 869kB May1 10)
- Bolivia-band4.tif (TIFF 869kB May1 10)
- Bolivia-band5.tif (TIFF 869kB May1 10)
- Bolivia-band6.tif (TIFF 869kB May1 10)
- Bolivia-band7.tif (TIFF 869kB May1 10)
Open and explore the seven Landsat bands
Before you merge the bands together to make color images, you'll open and examine them on their own.
- Launch ImageJ by double-clicking its icon
 on your desktop or by clicking its icon in the dock (Mac) or Launch Bar (Win).
 - Choose File > Import > Image Sequence..., navigate to the Bolivia folder, and import the seven images, representing the seven Thematic Mapper bands, into ImageJ as a stack.
- Move forward and backward through the stack. As you do, note the label of each slice, which lists the TM band it represents. Notice what appears light and what appears dark in each band. Notice which bands have a lot of contrast and which don't. Think about what this is telling you.
- After you have explored the images, close the stack.
For example...
Band 1 (blue) - Since the atmosphere scatters more blue light than other colors, band 1 images nearly always have low contrast.
Band 2 (green) - The peak sensitivity of the human eye is in the yellow-green part of the spectrum. The green band most closely represents the brightness and contrast of the scene as you would see it with your eyes.
Create a true color image
You are going to use these images to re-create a "true color" version of the scene by combining three bands that represent what is seen in red, green, and blue wavelengths.- Choose File > Open and open all seven of the Bolivia images, band1 through band7.
- Choose Image > Color > Merge Channels....
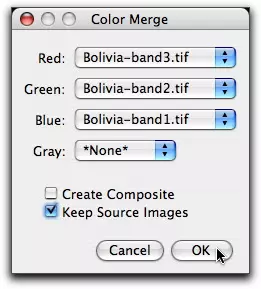
- In the Color Merge window, assign the band 3 image to the red channel, the band 2 image to the green channel, and the band 1 image to the blue channel. Leave the Create Composite option unchecked, but check the Keep Source Images option.
- Click OK. The result is a true color RGB image. It is called a 321 image, because of the bands assigned to the red, green, and blue channels of the image. (They are also called RGB321 images.)

Create a false color image
In your initial examination of the seven Landsat color bands, you noticed that some types of land cover appear very different in some bands than others. You are going to use other bands to create a "false color" version of the scene. In this case, you will create a 432 image.Vegetation and 432 false color images
You've probably seen this type of image used to show vegetation. In a 432 image, the bands are assigned as follows:- The Near IR band (4) is assigned to the Red channel.
- The Red band (3) is assigned to the Green channel.
- The Green band (2) is assigned to the Blue channel.
In this type of image, older, forest-type vegetation appears dark red, while crops and younger vegetation appear brighter red. Cities appear blue or gray, and bare ground appears grayish-brown.
Other false color band assignment combinations are used to study specific types of ground cover—water, minerals, vegetation, etc. Some of the links in the Resources section at the bottom of the page show examples of these different false color images and explain how they are used.
Create Your Own RGB True and False Color Images.
- Choose ONE set of Landsat images from the collections below.
- Download the 6-8 images (representing 6-8 Landsat bands) in that collection to your Week 11 folder.
- Open the images in ImageJ.
- Use Image > Color > Merge Channels to create both true and false color images by assigning different bands to the Red, Green, and Blue color channels.
- Save a copy of your favorite RGB color image AS A JPEG (Be careful—ImageJ always defaults to saving images in TIFF format!) to your Day 4 directory.
Landsat Image Collections—Choose ONE
Choose ONE of the Landsat image collections below, download the images to your computer and use them to create true and false color RGB images using ImageJ
Las Vegas, Nevada
- Vegas-band1.tif (TIFF 258kB May1 10)
- Vegas-band2.tif (TIFF 258kB May1 10)
- Vegas-band3.tif (TIFF 258kB May1 10)
- Vegas-band4.tif (TIFF 258kB May1 10)
- Vegas-band5.tif (TIFF 258kB May1 10)
- Vegas-band7.tif (TIFF 258kB May1 10)
Sioux City, Iowa
- Iowa-band1.tif (TIFF 258kB May1 10)
- Iowa-band2.tif (TIFF 258kB May1 10)
- Iowa-band3.tif (TIFF 258kB May1 10)
- Iowa-band4.tif (TIFF 258kB May1 10)
- Iowa-band5.tif (TIFF 258kB May1 10)
- Iowa-band7.tif (TIFF 258kB May1 10)
Baton Rouge, Louisiana
- Louisiana-band1.tif (TIFF 879kB May1 10)
- Louisiana-band2.tif (TIFF 879kB May1 10)
- Louisiana-band3.tif (TIFF 879kB May1 10)
- Louisiana-band4.tif (TIFF 879kB May1 10)
- Louisiana-band5.tif (TIFF 879kB May1 10)
- Louisiana-band6.tif (TIFF 879kB May1 10)
- Louisiana-band7.tif (TIFF 879kB May1 10)
Great Salt Lake, Utah
- Salt_Lake-band1.tif (TIFF 930kB May1 10)
- Salt_Lake-band2.tif (TIFF 930kB May1 10)
- Salt_Lake-band3.tif (TIFF 930kB May1 10)
- Salt_Lake-band4.tif (TIFF 930kB May1 10)
- Salt_Lake-band5.tif (TIFF 930kB May1 10)
- Salt_Lake-band6.tif (TIFF 930kB May1 10)
- Salt_Lake-band7.tif (TIFF 930kB May1 10)
Owens Valley, California
- Owens_Valley-band1.tif (TIFF 938kB May1 10)
- Owens_Valley-band2.tif (TIFF 938kB May1 10)
- Owens_Valley-band3.tif (TIFF 938kB May1 10)
- Owens_Valley-band4.tif (TIFF 938kB May1 10)
- Owens_Valley-band5.tif (TIFF 938kB May1 10)
- Owens_Valley-band6.tif (TIFF 938kB May1 10)
- Owens_Valley-band7.tif (TIFF 938kB May1 10)
Santa Cruz Valley, Arizona
- Santa_Cruz_AZ-band1.tif (TIFF 977kB May1 10)
- Santa_Cruz_AZ-band2.tif (TIFF 977kB May1 10)
- Santa_Cruz_AZ-band3.tif (TIFF 977kB May1 10)
- Santa_Cruz_AZ-band4.tif (TIFF 977kB May1 10)
- Santa_Cruz_AZ-band5.tif (TIFF 977kB May1 10)
- Santa_Cruz_AZ-band6.tif (TIFF 977kB May1 10)
- Santa_Cruz_AZ-band7.tif (TIFF 977kB May1 10)
Mono Lake, California
- Mono_Lake-band1.tif (TIFF 1MB May1 10)
- Mono_Lake-band2.tif (TIFF 1MB May1 10)
- Mono_Lake-band3.tif (TIFF 1MB May1 10)
- Mono_Lake-band4.tif (TIFF 1MB May1 10)
- Mono_Lake-band5.tif (TIFF 1MB May1 10)
- Mono_Lake-band6.tif (TIFF 1MB May1 10)
- Mono_Lake-band7.tif (TIFF 1MB May1 10)
Your Assignment: Locate a Multispectral Image and Discuss It
- Visit the Landsat Event Gallery by going to the Index of Landsat Images.
- Find a Landsat image that you think you could use in your teaching.
- Click the image and read the description, including the bands used to create the image. (Is it true or false color?)
- Go to the Part 2: Share and Discuss page and post the name of the image you selected from the Landsat Event Gallery, along with a description of the spectral bands used to create the image and what land features are highlighted by those spectral bands.
- Share one or more ideas about how you might incorporate the use of these multispectral images into your teaching, engaging in an online discussion with colleagues.
Source
1Adapted from Earth Exploration Toolbook chapter instructions under Creative Commons license Attribution-NonCommercial-ShareAlike 1.0.2Adapted from Eyes in the Sky II online course materials, Copyright 2010, TERC. All rights reserved.
3New material developed for Earth Analysis Techniques, Copyright 2011, TERC. All rights reserved.


