Initial Publication Date: July 11, 2011
DOIThis page currently has no DOI, but you may request a DOI be assigned. |
Cite thisPart 1: Download Images from NASA NEO Website1 2
The NASA Earth Observations (NEO) site is a great place to find imagery of NASA Earth science datasets. With NEO, you can download global and regional imagery in a variety of formats: PNG, JPG, GeoTIFF, and Google Earth. Additionally, NEO allows users to resize images and download them in color or grayscale. Users can also import NEO images directly into NASA's Image Composite Explorer (ICE) tool to perform basic analysis and explore relationships between datasets. NEO includes over 20 distinct atmosphere, ocean, and land datasets, which are available as global snapshots in daily, weekly, and monthly time spans, and most are available at 0.1 degree (10-kilometer) resolution. The website has a Flash interface and therefore requires a Flash player to operate.
Select and Display a Map for a Given Time Period
Go to the NASA Earth Observations (NEO) website and display the Energy Dataset, Reflected Shortwave Radiation image for January 1, 2009 to January 31, 2009.
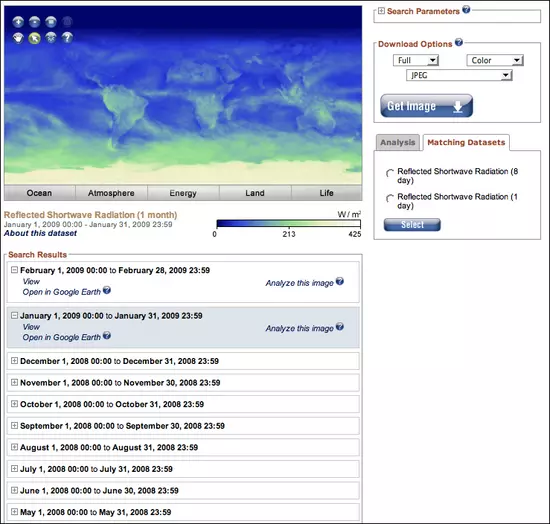
- Go to the NASA Earth Observations (NEO) website. The NEO Web site opens in a new browser window. Be sure to use a Web browser that is both Flash and Java enabled. NEO organizes datasets into five categories: Ocean, Atmosphere, Energy, Land, and Life. Click the Energy tab under the map to display the Energy Datasets.
- Locate the Reflected Shortwave Radiation dataset in the list and click it.
- The display window loads the most recent monthly map of Reflected Shortwave Radiation. To select a particular month of interest, refer to the Search Results field below the map. This field lists the most recent 10 months out of the twelve months for which this map is available. Click the Next link at the bottom of the list to get to January 2009.
- Click the "+" symbol to expand the field for a given date range.
- Click View to display the map for that date range within the NEO interface.
Find Out About the Dataset Used to Produce the Map
- Examine the January 1, 2009 to January 31, 2009 image of Reflected Shortwave Radiation.
- Click About this dataset to learn more details about what the map is showing.
- The About this dataset link is located in the lower left below the map.
- When you click the About this dataset link, the following text box opens.
- When the text box opens, use the information in it plus your observations to answer the following questions about the dataset:
- What areas are the brightest?
- What areas are the darkest?
- How would you define reflected shortwave radiation in terms of brightness?
- Download the January 1, 2009 to January 31, 2009 image at a resolution of 0.5 degrees and save it as 01_albedo.jpg. Repeat the process for all twelve months of 2009 until you end up with a total of twelve images, named from 01_albedo.jpg to 12_albedo.jpg.
- The January 1, 2009 to January 31, 2009 image is now displayed. In the Download Options box, change the selection from Full to Resize. Then select a fixed resolution of 0.5 degrees. Click the Get Image button to render the image.

- The rendered image opens in a new window. On a PC, right-click on the image and on a Mac, control-click on the image to download and save it. Do not change the file format, keeping the image as a jpeg. Save the image into the Albedo folder you created and name it 01_albedo.jpg.

- Click View to display the February 1, 2009 to February 28, 2009 image. Use the same procedure as above to resize and render an image with a fixed resolution of 0.5 degrees.

- Save the image, naming it 02_albedo.jpg.
- Use the Prev button at the bottom of the Search Results to access the remaining months from 2009. You should end up with a total of twelve images, named from 01_albedo.jpg to 12_albedo.jpg.
- If you had difficulty obtaining the images, then download and save the ones here. Click each thumbnail to open the full size image in a larger window. Then right-click or control-click to choose file Save Image As... Do not rename the files. Keep them as 01_albedo.jpg, 02_albedo.jpg, etc.
 January 2009
 February 2009
 March 2009
 April 2009
 May 2009
 June 2009
 July 2009
 August 2009
 September 2009
 October 2009
 November 2009
 December 2009
- Create a folder (directory) on your computer for your Day 2 files.
- Use the process described above to gather your own set of time-series images from one of the other datasets within NEO and save these to the Day 2 folder.
- In Part 2, you will be stacking and animating these images, so be sure to gather at least 12 images.
- Then go to the Part 1: Share and Discuss page and post just one of your images to demonstrate that you can download an image from NEO.