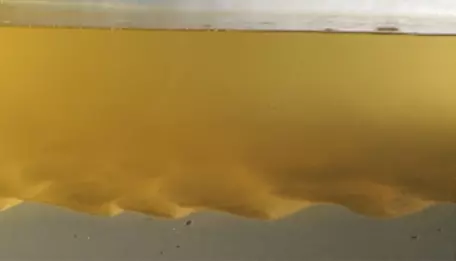
 Dune formed in 0.8 mm sand
 From initiation of motion to antidunes: videos of the unidirectional flow bedform progression
Thomas Hickson*, Michael Kolles*, Paul Southard+, and Jeni McDermott*
*Department of Geology, University of St. Thomas, 2115 Summit Ave., St. Paul, MN, 55105
+Geosciences, University of Massachussetts, 611 North Pleasant Street, 233 Morrill Science Center, Amherst, MA 01003-9297
Although there are a number of isolated videos of bed forms available on the web, nowhere is there a complete video that shows the evolution of a sand bed under increasing velocity unidirectional flow. To remedy this, we created a set of videos of flume experiments conducted at the St. Anthony Falls Laboratory, University of Minnesota. These experiments show the progression from initiation of motion through ripples, dunes, upper plane bed, and antidunes. Both real-time and time-lapse videos are included. We used acoustic doppler velocimetry to measure velocity profiles for each bed configuration. Furthermore, we investigated bed forms in 0.11, 0.5 and 0.8 mm sand (D50), to encompass the range of grain sizes that produce different bed configurations.
We have put together two videos:
Bedform Progression with An Introduction to the Flume (small) (MP4 Video 40.9MB Apr24 18). This video contains an extended introduction to the flume in which the experiments were conducted. Click here if you would like to download an HD version of this same video (1.5 GB) (MP4 Video 1479.9MB Oct23 14)
Bedform Progression with No Introduction (small) (MP4 Video 15.9MB Oct23 14). This video lacks the introduction to the flume. Click here if you would like to download an HD version of this same video (~1 GB) (MP4 Video 629.3MB Oct23 14).
 Ripples forming 0.1 mm sand
 Acoustic Doppler Velocimeter Data
For many of the bed states in the videos above we captured velocity profiles using an acoustic doppler velocimeter (ADV). Three Excel files comprise the data here. Each file is coded by the grain size used in each run. Hence, 'ADV_0_5.xlsx' are the ADV data for the 0.5 mm grain size runs. There are three tabs in each file, one each for the X, Y, and Z components of velocity versus depth. Each velocity value is time-averaged over intervals between 5 and 20 seconds, depending on flow velocity (longer averaging times were used for lower velocities because the bed was not changing rapidly).
0.1 mm sand size run (Excel 2007 (.xlsx) 14kB Oct12 14)
0.5 mm sand size run (Excel 2007 (.xlsx) 15kB Oct12 14)
0.8 mm sand size run (Excel 2007 (.xlsx) 13kB Oct12 14)