Imagery from Ed Garnero
Ed Garnero of Arizona State University has been developing great visualizations of deep earth phenomena for several years. Below you can see a selection of his imagery and you can access his entire website at http://garnero.asu.edu/research_images/index.html.1. A cutaway into the earth showing very large scale seismic heterogeneities. Red are zones that slow down seismic waves, assumed to be hotter than average. blue are zones that speed up seismic waves, assumed to be colder than average. the blue regions correspond to locations beneath present or past subduction, the red regions correspond to locations beneath most of earth's hotspot volcanism at the surface. Hence, a picture of large scale mantle convection is advocated. seismic ray paths from a hypothetical earthquake near fjij in the SW pacifc travel right through these structures, when recorded in N and S america, and hence enable seismologists to image these structures.
http://garnero.asu.edu/publications/g081_Garnero,McNamara_PRimage.jpg
2. Using 10's of 1000's of SS waves and faint signals that arrive before them, due to reflecting off of upper mantle discontinuities (http://garnero.asu.edu/research_images/raypaths/taup_path.SS,S400S,S670S.gif) to map the relief on the 410 and 660 km deep phase boundaries (purple=deepened, white=elevated). http://garnero.asu.edu/research_images/interp2/garnero_SchmerrSci.jpg
We used these patterns to argue for the presence of water in the mantle (image courtesy of Nick Schmerr)
3. Earth's interior is still convecting present day. Oceanic crust and lithosphere fall into the mantle, and cool the mantle in those areas. Near the core-mantle boundary (CMB), the lowermost few hundred km of the mantle, known as D" (dee double prime) has been imaged by seismology to have a reflector of energy, thought to be due to a phase transition in the lower mantle (and Earth's) most abundant mineral: perovskite. The D" region has also been shown to have seismic wave speed anisotropy (red stiples). http://garnero.asu.edu/research_images/interp2/garnero25ani_scenario.jpg
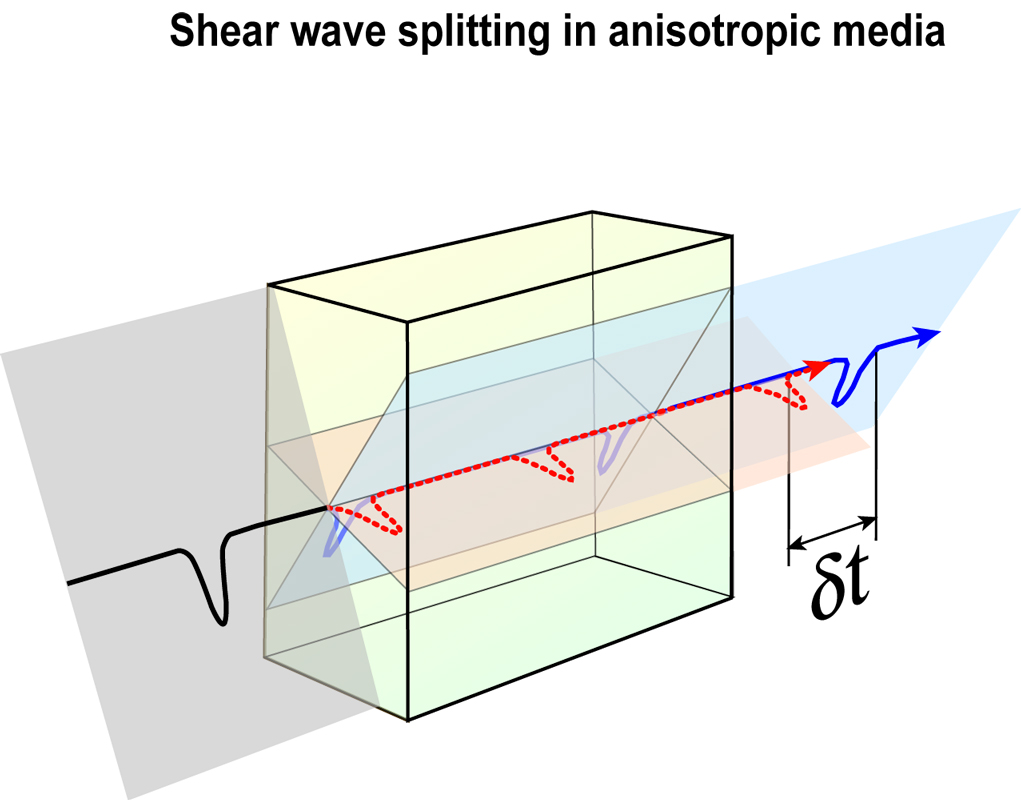
4. Seismic anisotropy images, PPT, and animation. These depict how seismic waves in an isotropic medium become polarized in an anisotropic medium, which can produce separate seismic pulse, which are in turn studied to image the medium's anisotropy. media:
image: http://garnero.asu.edu/research_images/anis/garnero13ani_crampin1.jpg I basically redrew the famous Crampin (1981) figure, in color.
image: http://garnero.asu.edu/research_images/anis/garnero14ani_crampin2.jpg The blue pulses represent the faster wave, the red pulses the slower wave. They bifurcate upon encountering the anisotropic medium.
image: http://garnero.asu.edu/research_images/anis/garnero15ani_crampin3.jpg When the two pulses reach an observatory, seismologists measure the differential time and polarzation of the energy.
animated gif: http://garnero.asu.edu/research_images/anis/garnero_splitting.gif