Process-microstructure mapping in additively manufactured components from SEM images
Summary
Learning Goals
Conceptual:
Understand how process parameters (e.g., laser power, scan speed) influence microstructural features (grain morphology, porosity, texture).
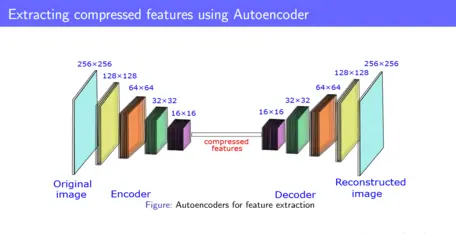
How to build Autoencoder for extracting compressed features.
Connect image-based observations to structure–property relationships.
Computational (MATLAB):
Import and preprocess SEM images.
Compute microstructure descriptors:
Porosity fraction via thresholding.
Grain size distribution via segmentation.
Texture or anisotropy.
Morphological metrics.
Correlate descriptors with process parameters using regression/plots.
Higher-Order Skills:
Critical thinking about experimental variability.
Data-driven modeling of materials processing.
Context for Use
Appropriate for upper-level undergraduate or graduate courses in Materials Science, Additive Manufacturing, and Computational Mechanics.
Works for class sizes 10–30 (lab groups) or larger if SEM images are available in advance.
Students should have prior exposure to basic materials processing concepts and microstructure interpretation.
Familiarity with MATLAB image processing functions is helpful but not necessary.
Description and Teaching Materials
Activity Description
Data Introduction: Students are given a dataset of SEM images of samples fabricated with different process parameters (e.g., laser power levels).
A CSV file links each image ID to its processing parameters.
Image descriptor extraction is done using MATLAB.
Students implement MATLAB scripts to compute features: mean grain area, porosity, pore eccentricity, FFT-based texture descriptors, and boundary length density.

![[reuse info]](/images/information_16.png)

![[creative commons]](/images/creativecommons_16.png)
Teaching Notes and Tips
Start with a brief lecture on process–structure–property linkage.
Emphasize preprocessing challenges.
Common caveats: poor segmentation, etc.
It takes time, so I believe it can't be done instantly.
Assessment
Assessment
Formative: Debugging image processing and machine learning scripts in the lab.
Summative: Lab report including:
Process parameters vs. microstructure plots.
Interpretation of why trends occur.
Critical evaluation of limitations.
References and Resources
SEM images of 3D printed components.