Instrumental Neutron Activation Analysis (INAA)
What is Instrumental Neutron Activation Analysis (INAA)
Fundamental Principles of Instrumental Neutron Activation Analysis (INAA)
58Fe + 1n → 59Fe + Beta- + gamma rays
The activity for a particular radionuclide, at any time t during an irradiation, can be calculated from the following equation
At = σactφN(1—e-λt)
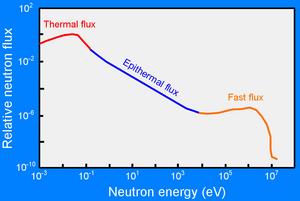
where At = the activity in number of decays per unit time, σact = the activation cross-section, φ = the neutron flux (usually given in number of neutrons cm-2 s-1), N = the number of parent atoms, λ = the decay constant (number of decays per unit time), and t = the irradiation time. From this equation we can see that the total activity for a particular nuclide is a function of the activation cross-section, the neutron flux, the number of parent atoms, and the irradiation time. Note that for any particular radioactive nuclide radioactive decay is occurring during irradiation, hence the total activity is determined by the rate of production minus the rate of decay. If the irradiation time is much longer than the half-life of the nuclide, saturation is achieved. What this means is that the rate of production and decay is now in equilibrium and further irradiation will not lead to an increase in activity. The optimum irradiation time depends on the type of sample and the elements of interest. Because the neutron flux is not constant, the total flux (called fluence) received by each sample must be determined using an internal or external fluence monitor.
It is sometimes useful to convert from half-life to decay constant. This can be done using the following equation
t1/2 = 0.693/λ
where t1/2 is the half-life and λ is the decay constant.
After the sample has been activated, the resulting gamma ray energies and intensities are determined using a solid-state detector (usually Ge). Gamma rays passing through the detector generate free-electrons. The number of electrons (current) is related to the energy of the gamma ray. Because there can be thousands to hundreds of thousands of gamma ray interactions per second with the detector, an important criteria in system design is the response time of the detector to gamma ray interactions (as measured by the dead time). Each radioactive nuclide is also decaying during the counting interval and corrections must be made for this decay. The standard form of the radioactivity decay correction is
A = Aoe-λt
where A is the activity at any time t, Ao is the initial activity, λ is the decay constant and t is time.
When subjected to a thermal neutron flux 235U atoms in a sample will undergo fission producing a variety of fission products, some of which are nuclides of interest. Hence, a correction that must be made, when U is present, is for the amount of a nuclide produced by the fission process.
Given the differences in half-lives for various nuclides, there are optimum times to count an activated sample. In general nuclides with relatively short half-lives, on the order of hours to days, are determined within the first week of irradiation. Nuclides with half-lives on the order of weeks to months are determined 4 to 8 weeks after irradiation. Hence, activated samples are counted several times after irradiation.
Instrumental Neutron Activation Analysis (INAA) Instrumentation - How Does It Work?
Applications
- Rocks, minerals, and soils
- Atmospheric aerosols
- Archaeological artifacts
- Tree rings
- Dust in ice cores
- Hair, nails, skin, etc.
- Plant and animal matter
- Coal
Strengths and Limitations of Instrumental Neutron Activation Analysis (INAA)?
Strengths
- Can analyze a large number of elements simultaneously
- Very low detection limits for many elements
- Small sample sizes (1—200 mg)
- No chemical preparation
- Non-destructive. The material is available for other analytical techniques
Additionally, compared to many analytical techniques, the instrumentation cost is relatively low. In 2007 it would cost about $50,000 to set-up an INAA laboratory.
Limitations
User's Guide - Sample Collection and Preparation
Data Collection, Results and Presentation
Among its many uses, INAA has been widely used to obtain analyses of the Rare Earth Elements (REE). Examples of REE data from a variety of rock types including phonolites, granites, syenites and nepheline syenites are displayed below.
Literature
The following literature can be used to further explore Instrumental Neutron Activation Analysis (INAA)
- Alfassi, Z.B., 1994, Chemical Analysis by Nuclear Methods. John Wiley and Sons, Inc.
- Gordon, G. E., Randel, K., Goles, G. G., Corliss, J. B., Benson, M. H., and Oxley, S., 1968, Instrumental activation analysis of standard rocks with high resolution gamma-ray detectors. Geochmicia et Cosmochimica Acta 32, 369-396.
- Lieser, Karl H., 2001, Nuclear and Radiochemistry, 2nd Ed.: John Wiley & Sons, Inc.
- Muecke, G.K., ed., 1980, Neutron Activation Analysis in the Geosciences: Mineralogical Association of Canada Short Course Handbook 5.
Related Links
For more information about Instrumental Neutron Activation Analysis (INAA) follow the links below.
- University of Massachusetts-Lowell INAA Laboratory - gives an overview of instrumental neutron activation analysis, applications, and links to other useful sites
- Canberra.com - technical descriptions of the various components of a gamma ray spectroscopy system.
- University of Missouri Overview of Neutron Activation Analysis - overview of neutron activation analysis.
- Wikipedia Neutron Activation Analysis - description of INAA; includes links to other sites.
Teaching Activities and Resources
Teaching activities, labs, and resources pertaining to Instrumental Neutron Activation Analysis (INAA).


