
X-ray Computed Tomography (CT)
Richard Ketcham, University of Texas at Austin
What is X-ray Computed Tomography (CT)
X-ray Computed Tomography (CT) is a nondestructive technique for visualizing interior features within solid objects, and for obtaining digital information on their 3-D geometries and properties.
 A CT image is typically called a slice, as it corresponds to what the object being scanned would look like if it were sliced open along a plane. An even better analogy is a slice from a loaf of bread, because just as a slice of bread has a thickness, a CT slice corresponds to a certain thickness of the object being scanned. So, while a typical digital image is composed of pixels (picture elements), a CT slice image is composed of voxels (volume elements). Taking the analogy one step further, just as a loaf of bread can be reconstituted by stacking all of its slices, a complete volumetric representation of an object is obtained by acquiring a contiguous set of CT slices.
The gray levels in a CT slice image correspond to X-ray attenuation, which reflects the proportion of X-rays scattered or absorbed as they pass through each voxel. X-ray attenuation is primarily a function of X-ray energy and the density and composition of the material being imaged.
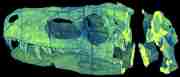
3D reconstruction of skull of Herrerasaurus, with cutaway showing brain case. Sample is 32 cm long. Details
The gray levels in a CT slice image correspond to X-ray attenuation, which reflects the proportion of X-rays scattered or absorbed as they pass through each voxel. X-ray attenuation is primarily a function of X-ray energy and the density and composition of the material being imaged.
Fundamental Principles of X-ray Computed Tomography (CT)
Tomographic imaging consists of directing X-rays at an object from multiple orientations and measuring the decrease in intensity along a series of linear paths. This decrease is characterized by Beer's Law, which describes intensity reduction as a function of X-ray energy, path length, and material linear attenuation coefficient. A specialized algorithm is then used to reconstruct the distribution of X-ray attenuation in the volume being imaged.


X-ray Computed Tomography (CT) Instrumentation - How Does It Work?
The elements of X-ray tomography are an X-ray source, a series of detectors that measure X-ray intensity attenuation along multiple beam paths, and a rotational geometry with respect to the object being imaged. Different configurations of these components can be used to create CT scanners optimized for imaging objects of various sizes and compositions.
The great majority of CT systems use X-ray tubes, although tomography can also be done using a synchrotron or gamma-ray emitter as a monochromatic X-ray source. Important tube characteristics are the target material and peak X-ray energy, which determine the X-ray spectrum that is generated; current, which determines X-ray intensity; and the focal spot size, which impacts spatial resolution.
Most CT X-ray detectors utilize scintillators. Important parameters are scintillator material, size and geometry, and the means by which scintillation events are detected and counted. In general, smaller detectors provide better image resolution, but reduced count rates because of their reduced area compared to larger ones. To compensate, longer acquisition times are used to reduce noise levels. Common scintillation materials are cesium iodide, gadolinium oxysulfide, and sodium metatungstate.

Applications
CT data have been applied to virtually every geological discipline, and new applications are being continually discovered. Successful applications to date include:

- Measuring 3D size and spatial distribution of crystals, clasts, vesicles, etc.
- Nondestructive volumetric study of rare specimens (fossils, meteorites, etc.)
- 3D measurement of fluid flow fields, including porosity, microporosity, and fracture extent and roughness
- 3D fabric determination (foliations, shape preferred orientations, network properties)
- Inspection and measurement of morphology in fossils and Recent biological specimens
- Detection and examination of high-density economic trace phases
- Reconnaissance imaging of samples for optimal geochemical exploitation (for example, locating crystal central sections, spiral axes, solid and fluid inclusions).
Strengths and Limitations of X-ray Computed Tomography (CT)?
Strengths
- Entirely non-destructive 3D imaging
- Little or no sample preparation required
- Reconstruction is generally attenuation-conservative, allowing sub-voxel level details to be extracted.
Limitations
- Resolution limited to about 1000-2000x the object cross-section diameter; high resolution requires small objects
- Finite resolution causes some blurring of material boundaries
- Calibration of gray levels to attenuation coefficients complicated by polychromatic X-rays
- Large (dm-scale) geological specimens cannot be penetrated by low-energy X-rays, reducing resolving capability
- Not all features have sufficiently large attenuation contrasts for useful imaging (carbonate fossils in carbonate matrix; quartz vs. plagioclase)
- Image artifacts (beam hardening) can complicate data acquisition and interpretation
- Large data volumes (gigabytes+) can require considerable computer resources for visualization and analysis
User's Guide - Sample Collection and Preparation
The only preparation necessary for CT scanning is to ensure that the object fits inside the field of view and that it does not move during the scan. Because the full scan field for CT is a cylinder (i.e., a stack of circular fields of view), the most efficient geometry to scan is also a cylinder. Thus, when possible, it is often advantageous to have the object take on a cylindrical geometry, either by using a coring drill to obtain a cylindrical sample or by packing the object in a cylindrical container with either X-ray-transparent filler or with material of similar attenuation characteristics.
Data Collection, Results and Presentation
CT data generally take the form of a sequence of image files, which can be visualized and analyzed using a wide variety of 2D and 3D-based image processing tools. The gray-level data values in CT images are generically called CT numbers. However, CT numbers typically vary from scanner to scanner, and even scan to scan.
The two standard modes of 3D visualization are volume rendering and isosurfacing. Volume rendering consists of mapping each CT value to a color and an opacity. Thus, some phases can be rendered transparent, allowing internal features to be revealed. Isosurfacing involves defining 3D contour surfaces that delineate boundaries between CT numbers, much as contour lines separate elevations values on a topo map.
Because CT data sets typically comprise hundreds of images and thousands of megabytes, they are not amenable to traditional publishing. However, CT data and visualizations are increasingly being served over the world wide web. An example is the Library of Digital Morphology website.
Literature
The following literature can be used to further explore X-ray Computed Tomography (CT)
- ASTM, 1992, Standard Guide for Computed Tomography (CT) Imaging, ASTM Designation E 1441 - 92a. In: 1992 Annual Book of ASTM Standards, Section 3 Metals Test Methods and Analytical Procedures. ASTM, Philadelphia, pp. 690-713.
- Ketcham, R.A. and Carlson, W.D., 2001, Acquisition, optimization and interpretation of X-ray computed tomographic imagery: Applications to the geosciences. Computers and Geosciences, 27, 381-400.
Related Links
For more information about X-ray Computed Tomography (CT) follow the links below.
The University of Texas CT Lab web site provides more information on principles and many example applications.
Teaching Activities and Resources
Teaching activities, labs, and resources pertaining to X-ray Computed Tomography (CT).


