For the Instructor
These student materials complement the Coastal Processes, Hazards and Society Instructor Materials. If you would like your students to have access to the student materials, we suggest you either point them at the Student Version which omits the framing pages with information designed for faculty (and this box). Or you can download these pages in several formats that you can include in your course website or local Learning Managment System. Learn more about using, modifying, and sharing InTeGrate teaching materials.Step 1: Use the PSMSL visual data explorer tool to locate your sites.
First, go to the PSMSL website.
An example of the interface is shown in Figure 4.40. Select the "Series Length" disply option in the PSMSL Data Explorer panel. Whenever possible, we will give preference to longer data sets (50+ years or more). Click on the balloon marker at any site for which you would like to view data. Here we have selected Balboa, a site in Panama near the Panama Canal. This site has data from 1908 to 2012 and is nearly 99.4% complete. This is an excellent dataset and would be a great candidate for analysis due to its length and completeness.
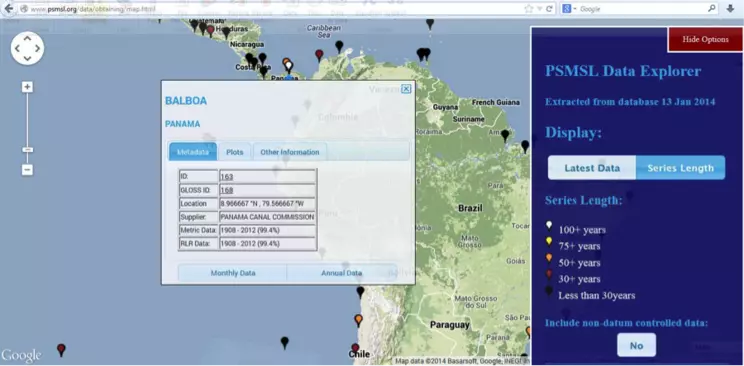 Figure 4.40: Screenshot of the PSMSL database user interface. Tide records from Balboa, Panama are shown. This record
shows that there are data from 1908 to 2012, with 99.4% complete.
Credit: PSMSL database user interface: Screen clipping taken: 1/15/2014 8:45 PM
- To quickly see the data visually, click on the "Plots" tab in the pop-up window. This will bring up two plots: one for monthly and one for annual means. In this example, only one year, 1987 is missing. What happened in Panama in 1987 that may have interrupted data collection? In 1987, political corruption led to unrest which ultimately required the use of force by the U.S. to help the country return to stability, after which the tide station at Balboa was able to get back online and continue its monitoring mission.
- Once you are satisfied with your dataset, you will download the Monthly Data graph. There are several ways to do this, but the easiest is to click on the "Other Information" tab and then click on "Documentation" under Station Information. A new page should open that would look something like the image in Figure 4.41. Find the Tide Gauge Data plots below the Station Information section.
- Click on the link to the right of the Monthly Data plot that says "Link to larger image of the monthly data plot". This will direct you to a .png image file. Go to the "File" menu in your browser, or right click on the image, and select "Save page as..." or "Save image as..." and save the .png fie to your Desktop or a folder of your choosing. Make sure you name the plot with the site name when you save it so you will know which plot belongs to which site. You will have three of these by the time you're done, so it's best to keep them organized from the start.
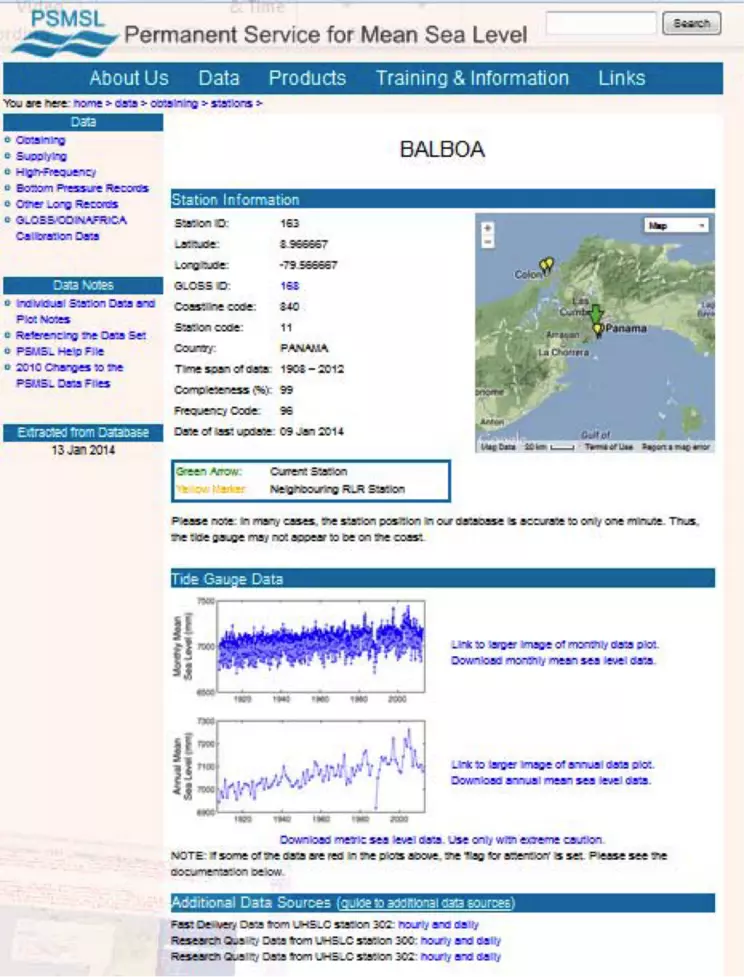 Figure 4.41: Station information screen for the Balboa site in Panama. Tide Gauge Data for this site and other data sources are available by clicking the links provided.
Credit: PSMSL: Screen clipping taken: 1/15/2014 8:58 PM

