Week 5: Monitoring Invasive Species
On This Page
Adjust the layers and Zoom in to the Zebra Mussel Layer
Find a Feature by Its Attributes
Question a Database with the Query Builder
- Find All the Zebra Mussels Sighted in the Year 1988
- Find All the Zebra Mussel records from New York
- Combine Queries to find Mussels in New York in 2005
- Set up Query to find a set of Zebra Mussels between 1997 and 2000
- See how Zebra Mussel Invasion Progressed Over Time
Build Your Own Database Query and Take a Screenshot
Explore More If You Have Time
Resources
Movies on This Page
Getting to Know Querying in ArcGIS
Learn to create and execute GIS database queries to investigate the spread of zebra mussels.
top of pageLaunch ArcGIS, Open the Invasive Species Project File, and Add a New Layer

- Launch ArcGIS by double-clicking its icon on your desktop or by clicking its icon in the Start > All Programs > ArcGIS > ArcMap.
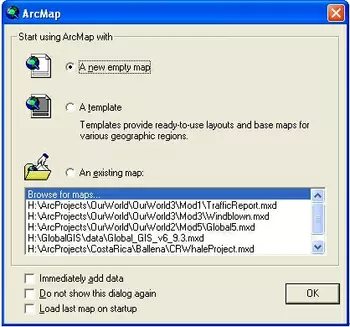
- A startup window opens and asks if you want to start from an empty interface or a past project. Choose the New Empty Interface radio button.
- On the tool bar usually at the top of the interface, click on the File > Open, navigate to your C:\\EyesInTheSky2\Week5 folder and select the file inv_spc.mxd. Then click Open.
- Add a new layer to show the sightings of the invasive Zebra Mussels. Click the Add Data
 button. Navigate to the invasive_speciesAM folder. Click once on zebra_mussel.shp to select it. Then click Add.
- zebra_mussel should now be the top layer on your map. Notice that the layer is automatically turned on when it is added.


top of page
Zebra mussels are small shellfish named for the striped color of their shells. They typically attach to objects by threads on their shells. The zebra mussel is native to the Black, Caspian, and Azoz Seas. They were first described in Europe, by Pallas, in 1769.
Zebra mussels were first discovered in the Great Lakes of North America in 1988. It is likely that their introduction was due to a ballast exchange from a cargo ship. By 1990 they had spread rapidly to all of the Great Lakes. Soon thereafter they escaped to the Illinois and Hudson Rivers, eventually moving into the Mississippi River system. By 2008, Zebra Mussels had spread across the United States, all the way to California.
Zebra mussels are a significant invader because they can spread both in and out of the water. In their freshwater habitat they can disperse in all life stages. They are prolific biofouling agents and therefore have profound effects on water supply pipes, including nuclear power plant cooling intake pipes. Not only do they damage man made structures, they are disruptive to entire food webs. Zebra mussels primarily consume phytoplankton. Additionally, they consume other suspended materials in the water column. Consequently, areas with dense invasions of zebra mussels have unusually transparent water. In fact, during the invasion of zebra mussels in Saginaw Bay, Michigan the sampling areas experienced a 60-70% reduction in Chlorophyll –a concentrations.
Adjust the Layers and Zoom in to the Zebra Mussel layer
- Turn on the US States and US Rivers layers.
- Right click on US Rivers in the Table of Contents and click on Zoom To Layer.

- Right click the zebra_mussel layer in order to zoom to the current extent of the zebra mussel invasion.
The map shows the extent of the zebra mussel invasion in the United States as of 2008.

Find A Feature By Its Attributes
The Find tooltop of page
Find the zebra mussels in Ohio.
- Right-click on the zebra mussel label in the Table of Contents. Then select Open Attribute Table. Spend some time looking through the fields and data records that are in the table. Use the scroll bars to move up and down and across the table. Look carefully at the State abbreviations.
- Close the Attribute Table.
- Click on the Find
 tool. When the Find window opens, move it so you can see the both the map and the window.
- In the window that pops up, on the Features tab, type in the name of the abbreviation for the State of Ohio, OH in the Find: box..
- Select zebra_mussel from the "In:" list of Layers to Search. Click Find to search for the features in the layer that have "OH" as an attribute.
- In the results section of the Find window, 198 records have been located. The first result is highlighted. Click a row to make the record flash. Right click to select the zebra mussel record and highlight it in blue on the map.
- Click on other records in the list of results and watch the blue dot move around on the map.
- To select a group of records, hold the shift key down while clicking on results in the Find window.
- When you are done, click the Clear Selection button (in the toolbar area)
 to clear all selections from the map.


