Part 2: Explore and Investigate Digital Images to Develop an Understanding of Their Properties2
Download a Greyscale and a Color Image
Download these two images of Lake Mead.- Click the grayscale thumbnail image below to open a full-size version in a separate window. Then right-click (Win) or control-click (Mac) the full-size image to choose File > Save Image As... and save it to your Day 1 folder. Close the image window after you have downloaded its file.
 lake_mead_2004_grayscale.jpg
 lake_mead_2004_color.jpg
Explore a Digital Image
- Double-click the ImageJ icon
 to launch the application.
 - In ImageJ, choose File > Open..., navigate to your Day 1 folder, and open the lake_mead_2004_grayscale.jpg file. This is a grayscale satellite image of the area around Lake Mead, Nevada, taken by one of the Landsat satellites.
- Using the Magnifying glass tool
 , click once anywhere on the image. Keep clicking on the image, counting your clicks and watching how both the image and the image window title bar change as you zoom in.
 - What is the maximum magnification of the image, and how many clicks does it take to get there?
- To zoom out, hold down the Alt (Win) or Option (Mac) key while you click on the image with the Magnifying glass tool
. You can keep zooming out beyond 100%, all the way down to about 3%. This may be useful when you are working with very large images and you need to see the entire image on screen at one time.
- To quickly return to 100% from any magnification, double-click the Magnifying glass tool
on the toolbar.
- Zoom in to about 800% magnification.
- Use the Scroll tool
 to drag the image in the window in any direction. Because it's often useful to scroll the image while you're using other tools, you can bring up the scroll tool at any time by pressing the space bar. Try it now — select a different tool, move your cursor back over the image, hold down the space bar, and drag the image around in the window.
 - Zoom in until you can easily see the individual pixels.
- Move your cursor around the image and watch the numbers on the ImageJ status bar (just below the toolbar in the ImageJ window). The x and y values represent the x (horizontal) and y (vertical) coordinates. In math class, the origin (0,0) is usually in the lower left corner of a graph. Where is the origin — coordinates (0,0) — of a digital image?
- To the right of the x and y coordinates on the status bar, it says value = and a number. Move your cursor around the image some more and see if you can tell what the value represents.
- Zoom back out to 100% and move your cursor over a dark region of the image, then over a light region, watching the value change.
- Mentally fill in the blanks of this statement with appropriate words: "In this image, light pixels have ______ values and dark pixels have ______ values."
- What's the lowest pixel value you can find in the image? What's the highest?
- Choose Image > Lookup Tables > Fire. Your image should now look very different. Try out several other lookup tables and see how they affect the appearance of the image.
- Close the lake_mead_2004_grayscale.jpg image.
- Navigate to your Week 2 folder and open the lake_mead_2004_color.jpg file. This is a color version of the image you have been working with.
- Briefly explore the image by zooming, scrolling, and looking at coordinates and pixel values. Do you notice anything different about those pixel values?
- Close the color image.
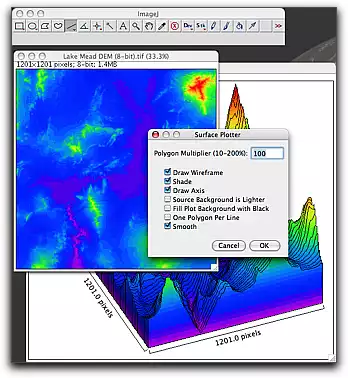
- Right-click (Win) or control-click (Mac) the link below and download the image file to your Week 2 folder. Lake Mead DEM (8-bit) (TIFF 1.4MB Jan30 10)
- Open the lake_mead_dem_8-bit.tif file.
- Can you find the elevation of the lake itself?
- Apply different lookup tables to the image (Image > Lookup Tables).
- Use Analyze > Surface Plot to re-create a 3-D view of the scene. Choose Analyze > Surface Plot. Check Draw Wireframe, Shade, Draw Axis, and Smooth in the Surface Plotter dialog box.
- Use one of the line selection tools to select a path through the scene. Then choose Analyze > Plot Profile to create a profile plot along the path.
- Close the lake_mead_dem_8-bit.tif image.
- Choose any remote sensed image. Open it using ImageJ and zoom in until you see the individual pixels.
- Use the Scroll tool
to hover over a pixel, reading its values and coordinates in the status bar.
- Write a brief description explaining what these numbers mean.
- Take a screenshot of the image while still zoomed in and showing the pixel you described.
- Then go to the Part 2: Share and Discuss page and post your image and description.
- Press Command-Shift-4 (Command key = Apple key) all at the same time and drag a box over the area of the screen that you want to capture. Depending upon your operating system, this will produce a file named Picture1.png or Screen shot Date Time.png on your desktop. Move the screenshot to your Day 1 folder or to a place where you can easily find it. Double click on the file to open it in Preview. Rename the image and save it as a jpeg, giving it a name that describes it, such as Lake_Mead_pixel_zoom.jpg.
- Press Alt and Printscreen at the same time. This will save an image of the screen to the computer's clipboard.
- Launch Paint and choose Edit > Paste.
- Save the image as a jpeg, giving it a name that describes it, such as Lake_Mead_pixel_zoom.jpg.
Zoom in and out


Scroll to move around
When you're zoomed in, how do you move around an image?
Investigate Pixel Data
By the numbers - pixel values and coordinates

An important concept here is that storing all this information in an image file on your computer is much more efficient than it seems. The computer doesn't need to store x- and y-coordinates — just the pixel values, in one long string, plus the width and height of the image. The coordinates are just information about the pixel under the cursor — its column and row number — that the software reports to the user.
To reconstruct the image correctly, the computer just needs to "know" the number of columns and rows in the image. This kind of grid of rows and columns is also called a raster, which is why this type of digital image is also called a raster image and why ImageJ is called a raster image processor.
Play With Color
Lookup tables
So far, you know that a digital image is a string of numbers arranged in rows and columns. How does the computer know what each number should look like when it displays that pixel on your screen? It's pretty simple, really. In addition to a string of numbers, the computer has a "secret decoder ring" called a Lookup Table that it uses in paint-by-number fashion. In a very simple image with only four possible values, the lookup table might look like 0 = black, 1 = blue, 2 = red, 3 = white. In an 8-bit image, the 256 possible values correspond to 256 colors. (Okay, we know what you're thinking, but black, white and all those grays ARE colors!) The lookup table can be stored in the file with the data, or you can control it using the software that's displaying the data.

This image is an 8-bit image. Each pixel is represented in the computer's memory by an 8-bit binary number, representing 256 possible values from 0 to 254. Another term for the number of binary bits used to describe the value of a pixel is bit depth. You can think of the bit depth as the 3rd dimension of an image (width and height are the other two).
Color images

When Values Represent Something Other Than Brightness


Your Assignment: Zoom in on a Remote Sensed Image and Take a Screenshot
Screenshot Instructions for Mac Users
Screenshot Instructions for PC Users
Source
1Adapted from Earth Exploration Toolbook chapter instructions under Creative Commons license Attribution-NonCommercial-ShareAlike 1.0.2Adapted from Eyes in the Sky II online course materials, Copyright 2010, TERC. All rights reserved.
3New material developed for Earth Analysis Techniques, Copyright 2011, TERC. All rights reserved.