Modeling Exsolution (and Perthite Formation) as an Example of Complex-System Behavior
Summary
Context
Audience

Skills and concepts that students must have mastered
How the activity is situated in the course
The use of multiple representations of a phenomenon (exsolution) are used to provide different perspectives to foster more complete understanding. Students must be able to integrate information provided by: 1) physical samples (manipulatives), 2) a kinesthetic/physical modeling activity, 3) plots of data to derive a mathematical model of the process, 4) a computer-based simulation model, and 5) a visualization that represents the physical process of exsolution in a T-X phase diagram (alkali feldspar solvus). This activity makes the connection between a physical phenomenon that occurs in nature with model-based representations of complex-system behavior.
Goals
Content/concepts goals for this activity
- To develop a first order understanding of the process of exsolution. Natural occurrences of perthite (observed in hand sample, thin section and TEM images) are related to physical, computer, and mathematical models (e.g. Fick's Laws of diffusion) that provide multiple representations of the process of exsolution.
- To recognize complex-system behavior in the relatively common feature of perthitic alkali feldspar. This includes examples of scale-invariance of exsolution that typically develops over many orders of magnitude, and exsolution as an emergent and self-organizing phenomenon.
- To recognize that atomic-scale processes result in mesoscopic products, and
- To develop the ability to infer process from observations of natural materials.
Higher order thinking skills goals for this activity
- Data analysis
- Quantitative skills
- Developing visual literacy
- Thinking across multiple spatial scales
- Discovering the relationship between theory and natural phenomena
- Integration of different types of datasets
Other skills goals for this activity
- Collaborative learning
- Computer modeling
- Graphical representations of data
Description of the activity/assignment

A good example of this process can be seen in the alkali feldspar mineral group. At high temperature the mineral anorthoclase (K,Na)AlSi3O8 shows complete solid solution, i.e. there is a random distribution of K and Na in the alkali sites of the crystal. Upon cooling, Na and K segregate into more ordered domains creating areas that are rich in albite NaAl Si3O8 and microcline KAlSi3O8(see Figure 1).
The purpose of this exercise is to provide a number of activities to demonstrate how exsolution works and to demonstrate complex-system behavior in this relatively common natural phenomenon.
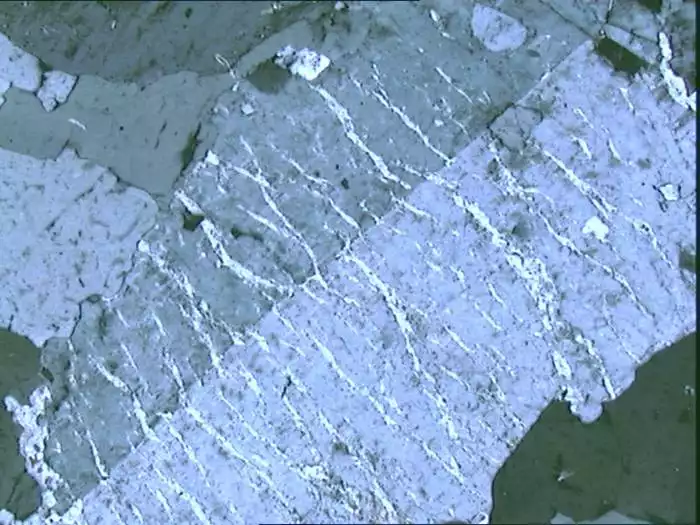
Part I: Images of naturally occurring perthite.
The following images show minerals that have undergone exsolution at different scales. The image on the top left shows exsolution as viewed with a Transmission Electron Microscope (TEM; field of view is 10 microns). The image on the top right is a photomicrograph of exsolution in microcline as seen in thin section (cross-polarized light, field of view is 2 mm). The picture on the bottom left is a hand sample of perthitic microcline as seen in hand sample (field of view is 10 cm). The picture on the bottom right is a picture of plagioclase feldspar showing the "schiller" effect. This is caused by sub-microscopic unmixing of two distinct plagioclase phases in the compositional range of labradorite (An50 - An70) which results in the beautiful play of colors seen in this photo; (field of view of 20 centimeters). This series of pictures is a good example of scale invariance of this physical phenomenon.
Examine perthite textures from hand samples and thin sections from your own mineralogy collection. We can easily envision unmixing of two immiscible fluids--for example oil and vinegar salad dressing. The same thing happens when we unmix (i.e. exsolve) solid phases--the process just takes a bit longer as atoms have to migrate in the crystal lattice by intracrystalline diffusion! How can such a common feature as perthite be understood in terms of complex-system behavior?


Part II: Exsolution Puzzle Exercise.
This exercise is done in groups of 2-3 students. Coins are initially randomly distributed on a chessboard, and are then subsequently moved to create domains of increasing order (regions that are dominated by either pennies or nickels). This is a kinesthetic learning exercise that creates a physical model that simulates how the exsolution process works. (Inspired by Greg Marfleet, Carleton College)
- Randomly distribute 20 pennies and 20 nickels on the attached 7x7 chessboard (Microsoft Word 33kB Dec1 10). The random distribution of pennies and nickels is analogous to the random distribution of Na and K in the high temperature alkali feldspar, anorthosite. (See Figure 1)
- The goal is to have a given coin completely surrounded by similar neighbors (i.e. 8 nearest neighbors of the same type of coin located on adjacent edges and the diagonal squares. Each student will sequentially move a coin into an adjacent open position (horizontal, vertical and diagonal moves are allowed) to achieve this desired configuration. Perfect ordering of nickels and pennies into discrete domains is analogous to perfectly ordered crystals of albite and microcline. [NOTE: in this exercise we are modeling the diffusivity of only the alkali elements, Na and K. The ordering of Si and Al in the tetrahedral sites of a feldspar crystal is a related, but entirely different process].
- Systems tend to minimize Gibbs Free Energy (see Figure 2) on their way towards a state of equilibrium. In this example, the surface area surrounding domains of the segregated compositions (nickels/Na and pennies/potassium) is proportional to the excess Gibbs Free Energy of those domains. As clusters of similar coins evolve (segregate) and get bigger, the bounding surface areas are minimized and the energetics of the system are decreased.
INSTRUCTIONS
- For the initial random state, determine the area surrounding each type of element; do this by assuming the unit length along each edge is 1 and add all the surfaces surrounding Na/nickel and K/potassium coins or aggregates of coins. Count any edges that are not adjacent to another similar coin (i.e. count all nickel-penny interfaces, and any edge where a nickel or penny is adjacent to an open space. Do not count the external edges on the outer border of the chessboard).
- Make 10 moves of the coins (always moving into an adjacent open space either right, left, up, down, or on a diagonal) and again determine the bounding surface areas. Record these surface area values for pennies and nickels. Repeat after 20, 30, 40, 50, and 100 moves.
- After each set of moves, report your surface area measurements for both pennies and nickels to your instructor; record these values on a spread sheet for later plotting and analysis.
- This part of the exercise should take about 45 minutes to complete the sets of movements and measurement of the surface areas.
Here is an example experiment showing the progressive ordering of pennies (potassium) and nickels (sodium).


Plot your results. Assume that each move requires 1 unit of time.
- Plot your data on a X-Y plot with surface area on the Y axis and time on the X-axis. What is the distribution of your data? (Try plotting data for pennies, nickels, their sum, and their averages). Create a "best fit" curve through the data as plotted on this X-Y diagram (easily done with functions programmed into Excel). . What type of mathematical function is represented by a curve that has a steep slope to begin (left side of the plot), and becomes asymptotic to the X-axis away from the origin? Did you notice that the first set of coin moves produced the largest change in surface area, and that subsequent sets of moves produced smaller and smaller changes to the surface area?
- Have you seen other plots with similar profiles from your other studies in Earth Science?
- It appears that many processes in Earth Science may follow the same mathematical laws.
- Now plot your data on a log-log plot with surface area on the ordinate (Y-axis) and time on the abscissa (X-axis). Create a "best fit" curve through these data (easily done with functions programmed into Excel). What is the shape of this curve? Does this relationship demonstrate a) an exponential function? b) a power law?
- Here is an example dataset (Excel 74kB Dec1 10) for 12 experiments completed by the spring 2010 Mineralogy class at Montana State University. Raw data and corresponding graphs are presented in the attached spreadsheet file. Compare your results with those shown in this example exercise.
Intracrystalline Diffusion and Fick's Law
The rate of transport of mass (and energy) through a fixed medium can be described mathematically by Fick's Law of Diffusion.
Part III: Computer Simulation

- Experiment with this program by changing the input parameters to try to reproduce a) the pattern you developed in the puzzle model above, and b) perthite patterns observed in the natural microcline crystals.
Part IV: Visualization of the Development of Exsolution

Relate these products and processes to natural occurrences of perthite, and think about the changes that have to take place on the atomic scale to produce the mesoscopic features that are visible in hand samples.
Part V: Thought Questions
- Driving forces: in equilibrium thermodynamics, the system always drives towards the lowest Gibbs Free Energy. At equilibrium, chemical potential is zero. This typically means there are no compositional gradients. Why does this system drive towards segregated domains that are rich in Na and K?
- Consider entropy "in the system". What do we mean by "the system"?
- Refer to Ilya Prigogine's (winner of the 1977 Nobel Prize for Chemistry) classic work on this subject: Order out of Chaos, Man's New Dialogue with Nature (1984, Bantam Books, 394 pp.)
Determining whether students have met the goals
Teaching materials and tips
Other Materials
Supporting references/URLs
- Putnis, A., and McConnell on the Principles of Mineral Behavior. Chapter 5 discusses ordering and diffusion, and Chapter 8 presents further details of the exolution mechanism.
- Smith, J. V., 1974, Feldspar Minerals: Vol. 2: Chemical and Textural Properties, Springer.
- Yund, R.A. and McCallister, R.H., 1970. Kinetics and mechanisms of exsolution. Chem. Geol. 6,5.