
Unit 1: Introduction to the Geologic Timeline & Mass Extinctions
Summary
In this unit, students will identify mass extinctions as paleontologists have done and recognize and understand the "pull of the recent," that is, the human tendency to know more about events closer to the present. Students prepare by reading an article prior to class that describes mass extinctions. At the beginning of class, students place historical events along a physical model of the geologic timescale. Next, they examine a diagram showing changes in biodiversity across the last 542 million years and identify patterns in those data. Students and the instructor then finish class by discussing that although fossils (and rocks) are critical for explaining the present and predicting the future, their mechanisms of preservation biases our understanding of Earth's past.
Learning Goals
Students will:
- List the order in which major Earth history events took place and how far apart in time they were from each other and from the present.
- Explain the reasons why people understand and remember events from the recent past better than events from the more distant past.
- Analyze a graph of biodiversity of marine organisms over the last 542 million years, identifying patterns of change, including one or more of the mass extinctions and the "pull of the recent."
- Integrate their explanations of the patterns in the timeline at the start of class to make sense of the apparent increase in biodiversity over the last 100 million years.
Overarching Module Goals
- Use of data: In this unit, students are actually looking at, finding patterns in, and interpreting data including dates of past events, and marine-biodiversity data on the Sepkoski curve.
- Interdisciplinary and system-based problem-solving: Geological, biological, and historical events generally create the same pattern on a timeline, with more events marked closer to the present. Students coming from a biological perspective will more easily recognize taxonomic biases, and those who have taken geology before will be more aware of problems with burial and erosion of older rocks. Students with a background in history or archeology will know of similar problems in the study of human activity.
- Big Ideas of Earth Literacy: This unit addresses the use of Big Idea #1 (observation in science), #2 (the age of Earth), #4 (continuous change), and #6 (evolution of life) explicitly. It addresses #3 (Earth's systems), and #5 (Earth's status as a water planet) implicitly.
Context for Use
This unit could be used as a stand-alone lesson or as the introduction to a series of lessons on evolution and/or extinction (such as the Changing Biosphere Module) or to a unit on Earth history. It could be incorporated into an introductory geology, biology, or integrated-science class at the high school or university level. An upper-level geology class could use this lesson as an introduction to paleontology or geologic time. It can be used in almost any size of class, but is intended for a face-to-face lesson, and is designed for a 50-minute course.
This unit relies heavily on class discussion. The "Teaching Tips" section below includes recommendations on handling discussion.
The students read an assigned paper before class starts. If the school has an online course management system, or if the instructor has class time before the lesson, the students can also take a quiz on the reading. Have event cards printed out and and a timeline space labeled (see below).
Description and Teaching Materials
Preparatory Readings
Before class, students should read the following article: "The Biodiversity Crisis – Are Humans Causing a Sixth Mass Extinction?" by Holmgren (2017). This reading introduces students to the geologic record of mass extinctions, as well as the sixth (current) extinction, and provides context for evaluating patterns in the Marine Diversity and Mass Extinction section. In more advanced courses where an examination of the methods used to calculate numbers of species and extinction rates is desired, the Barnosky et al., 2011, Ceballos et al., 2015, and/or Pimm et al., 2014 reference articles could also be assigned.
If you want to assess their reading comprehension, or want them to self-assess it, you can give students access to a
/ (for instructors only) as a printout or through a course management system like Blackboard or Moodle. If you are printing it out, here is a (for instructors only).Geologic Timeline: Out of Balance (25–30 min)
The students will create a "human timeline," using the walls of their classroom, or a nearby hallway or sidewalk to space geologic events out along a linear timescale and discuss the resulting pattern.
Before class, the instructor should work out the scale of the timeline, either along the walls of the classroom, or a nearby space with plenty of room, using a meter stick or tape measure to stay consistent. Post the following labels (here's a printable timeline label file (Acrobat (PDF) 3kB Nov24 14)), spaced proportionately:
- 4.5 billion years ago (bya)
- 4 billion years ago
- 3 billion years ago
- 2 billion years ago
- 1 billion years ago
- 500 million years ago
- Right now
For example, if you teach in a square classroom with four walls, each ten meters long, you might decide to scale your timeline as 1 billion years = 8 meters, leaving the last 4 m as the indefinite future. In this case, place the first label (4.5 bya) in one corner, the second (4 bya) 4 m along the wall, the third (3 bya), 8 m further down the wall (2 m past the first corner) from the second, and so forth.
Create event cards to pass out, each with a different event and the date at which it happened. Start with "important" events that the students are likely to recognize from the geologic timeline, such as the formation of Earth (4.5 bya) and the extinction of the dinosaurs (65 million years ago). There are 24 such events listed on the recommended event list (Acrobat (PDF) 195kB Nov24 14), in order of priority. More advice on creating sets of cards is in the Teaching Notes and Tips on the Timeline Activity below. Point out that "~" next to a date means "approximately" and remind students that there are a thousand millions in a billion.
Have the students with event cards go stand at the appropriate spot on the timeline, and if some express surprise that so many "important" events are clustered so closely together, tell them that you want them to notice that clustering. For a small class, have the students read their cards. For a large class, use a full-sized sheet of paper for each event. Have the students hold them up, and have the other students walk along the timeline and read them.
Put the Unit 1 Presentation (PowerPoint 2007 (.pptx) 4.3MB Dec27 16) onscreen while the students return to their seats. Briefly go over the learning objectives, and tell them that you have questions for them to address using think-pair-share. You will ask a question, then they discuss it with a partner for two or three minutes depending on the question (be strict here), then you will choose a student (or let one volunteer) to give an answer to the class. Getting the answers will probably take slightly longer than the initial discussion did, especially if students have questions (3 minutes each or more).
Marine Biomes through Time (5 min)
Show the students images of a stromatolite reef like those in the Precambrian, the Ediacaran seafloor, a puzzling Cambrian organism, a Paleozoic predator, and a modern coral reef (all of these, with supporting background information, are on the slide show). This part can be skipped if time is tight. It is intended more to engage the students than to inform them.
Marine Diversity and Mass Extinction (~20 min)
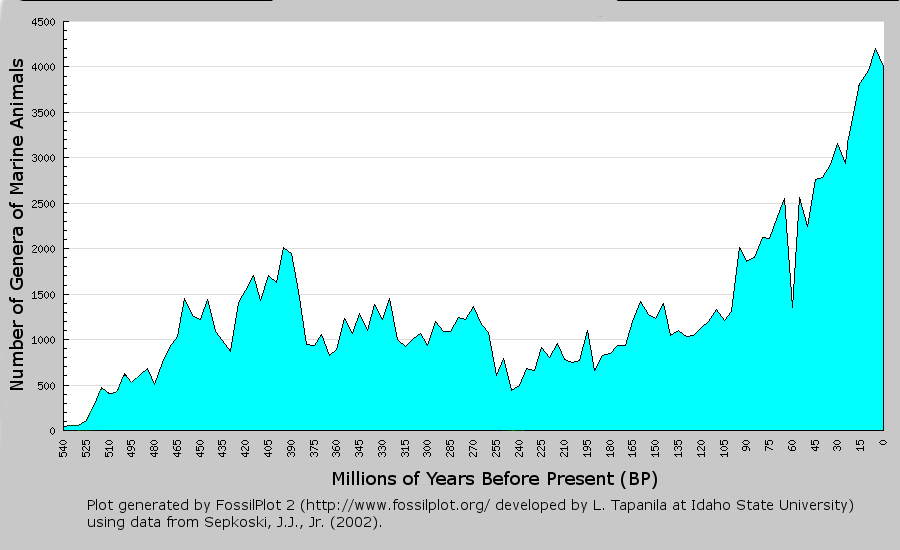
The last image in the slide show is a graph of marine biodiversity over the last 542 million years created from data published by David Raup and Jack Sepkoski (2002). You may need to review with the students what genera are, and why paleontologists would prefer to count genera rather than species (optional slide in the presentation). Give the students a minute to look at the diagram before they start to answer the questions.

![[creative commons]](/images/creativecommons_16.png)
Bias in Science (Optional — 10 min)
If there is a little extra time in class, there is a hidden slide with two more questions intended to connect this lesson with the broad idea of scientific bias (which generally has little in common with the social bias that students are used to hearing about).
Is Diversity Increasing Over Geologic Time? (Optional — 2 min)
Depending on the amount of understanding that the students show in their discussion of the marine biodiversity curve and how much time is available, you can describe one of the debates that these data have fueled:
Some members of the scientific community have argued that the increase in diversity in the last 100 million years is mostly real, only slightly emphasized by the pull of the recent. They have pointed out that most genera are made up of multiple species and can survive despite the loss of individual species. So the total number of genera should increase over time. If this is correct, even though the extinction rate is very high in the modern day, there are so many genera out there that only a small percentage of genera will be lost during the current extinction event.
However:- The earlier statistical studies of mass extinctions in the 1980s addressed the losses of entire taxonomic families, usually made up of multiple genera. The big five mass extinctions in the reading each killed off at least ten taxonomic families relatively quickly, and the end-Permian extinction included the death of an even bigger group (the trilobites). Mass extinctions involve global ecological collapses that would still be devastating in a high-biodiversity setting.
- Here is why humans should be concerned about the marine biodiversity curve we have been discussing. Humans are large (usually >44 kg as adults) organisms that need a lot of food, water, and oxygen to survive compared to most marine animals. During mass extinctions, species of large animals that do not hibernate and cannot go long without food, like humans, are among the most likely to go extinct. We need to understand how mass extinctions happen, both in the past and the present.
Note: There are no slides for this section.
Homework
The last slide includes a prompt for a short homework assignment (Unit 1 Homework Handout - MSWord (Microsoft Word 2007 (.docx) 15kB Dec27 16)/Unit 1 Homework Handout - pdf (Acrobat (PDF) 40kB Dec27 16)) asking students to respond to three statements about the content of this lesson. The instructor can collect these (or a random sample of them in a large class) to see whether the students engaged with the material that they read and discussed (Guidelines for Grading Homework (MS Word) (Microsoft Word 2007 (.docx) 12kB Jan19 17)/ Guidelines for Grading Homework (pdf) (Acrobat (PDF) 55kB Jan19 17)).
Teaching Notes and Tips
Handling discussion: During this unit, students should talk at least as much as the instructor, hopefully more. Whether in a large or small class, a good format for this kind of instruction is think-pair-share. At the start of class, tell the students to sit in pairs (or groups of three if someone is left alone without nearby neighbors). When the instructor presents the students with one of the discussion questions above, the students have a limited amount of time (2–3 minutes, specified with each question) to discuss it with one another.
During the discussion time, the instructor (and teaching assistants, if present) should move around the classroom, facilitating discussion and keeping students on track. Some students may choose not to speak, and these pairs or groups will fall silent quickly, as one student offers an answer and does not elaborate on it because his or her partners are not responding. Ask one of the silent students to express an opinion or, if they agree completely, to explain what the first student said in their own words. Ask the first student if he or she agrees with the paraphrased response.
When the instructor calls time, the students must stop, and then the instructor will ask at least one student to announce his/her group's answer. Even if the first student gives a good answer, other volunteers may have other perspectives or questions
In large classes, the instructor generally asks for a volunteer, and if there are several, chooses different ones to give answers first on different questions. In smaller classes, where participation is generally required, the instructor may call students from the roster and, over the term, give everyone a chance to speak (and to earn points if participation is being graded). If students are generally unable to participate in discussion because they come in poorly prepared (in this case, have not done the reading), give the reading quiz first for a grade.
Instructors who prefer not to rely on discussion should modify this unit, possibly having students fill out worksheets using the discussion questions individually (just adapt the presentation slides). An instructor might also choose to create a worksheet if there is no projector available for a slide show, and re-incorporate discussion by having students fill in the worksheet in pairs.
Timeline Activity : Instructors should create at least a few event cards to emphasize events or organisms that are addressed in other parts of the course or the direction of the course of the whole (climate history, evolution, etc.). Avoid creating a set of cards with events equally spaced in time, as this conveys a biased impression of the scientific understanding of geologic time, one that may make understanding of past mass extinctions, and recognition of the sixth mass extinction difficult. If using the event list included with this module, update the cards periodically as new discoveries re-date known events (especially oldest fossil-of-a-type).
Before class, when you are setting up your timescale, decide how much room you need. The activity is designed for 24 students, but in a larger class, either use a longer space for the timescale and create more event cards, or choose 24 students to hold event cards and have the others get up out of their seats to go look at the timeline. The maximum number of cards is limited by the amount of space available for the timeline. For example, 17 of the 24 events on the recommended event list (Acrobat (PDF) 195kB Nov24 14) occurred within the last 500 million years, so an instructor should have a timeline space about 22–25 m long (along a wall and turn corners) for those. That lets you cram 17 students into the final ~2.5 m. This spacing gives them a strong impression of how "crowded" that latest 500 million years has been without actually requiring them to be in physical contact (remind some to turn sideways).
If you have between 12 and 24 students, use only some event cards (the event list recommends which ones should be prioritized). If you have a very small class, have the students each take multiple event cards and tape them to the surface. This activity and the ensuing discussion should take no more than 25–30 minutes.
Marine-Life Slides: This part is teacher-centered and intended to engage more than to inform. If discussion runs a little long, omit the slide show. In any case, keep it short (5 min).
Examination of the Marine Diversity Diagram: Be careful about staying on time, both in terms of limiting lecture and keeping students focused, unless the students are highly engaged and you are willing to modify the lesson. Make sure to let your students know how long they have for each question on the slide. The discussion of the biodiversity curve should not go more than 20–25 minutes (especially the instructor's contributions).
Assessment
Assessment on Student Reading:
(for instructors only)- If you want to give this quiz to persuade the students to do the reading carefully before this class, administer it online through your course management system or have them do it as homework.
Consider using the discussion questions as short-essay exam or homework questions:
Learning Outcome #1:
-
What kind of pattern do well-known life history/Earth history events form on a timeline starting at 4.5 billion years ago and extending to the present?
Learning Outcome #2:
-
Describe two reasons for this kind of pattern in the timeline of Earth history. Use after the question about patterns in the timeline above.
- What kinds of events did we plot on the timeline? Why do we consider these events important?
Learning Outcome #3:
- Include the graph of marine animal diversity over the last 542 million years. Describe two kinds of patterns do you see in this graph.
Learning Outcome #4:
- The apparent increase in biodiversity after 100 million years ago is described as "Pull of the Recent." What are two reasons for it? Or one for lower-level students
- Why do we not see the current mass extinction at 0 years BP (the present) in the graph of marine biodiversity over the last 542 million years?
Instructors should consider modifying questions and setting standards for answers to best reflect the levels and emphases of their courses. Here is the
and (for instructors only).References and Resources
Reference Articles for Instructors on the Fossil Record of Mass Extinction:
- Raup, D.M., and Sepkoski, J.J. 1982. "Mass extinctions in the marine fossil record," Science 215(4539), 1501–1503.
- Tapanila, L. 2007. "FossilPlot, an Excel-based computer application for teaching stratigraphic paleontology using the Sepkoski compendium of fossil marine general," Journal of Geoscience Education 55(2), 133–137.
Data Sources:
- Sepkoski, J.J., Jr., 2002. "A compendium of fossil marine animal genera," Bulletins of American Paleontology 363, 1–560.
Additional Resources for Instructors and Students:
- Introduction to Mass Extinctions (University of California Museum of Paleontology) — a very short summary of mass extinctions, especially the end-Cretaceous one.
- Learning from Past Extinctions, by Anthony D. Barnosky PhD (HHMI BioInteractive) - a video describing evidence for the sixth mass extinction and its significance.
- Deep History of Life on Earth (HHMI BioInteractive) — an interactive diagram describing major events in life history.
- Fossil Plot (Idaho State University) — interactive graphics software that lets students plot Sepkoski's data.
- Geologic Time Scale (University of California Museum of Paleontology) — a geologic timescale (not in linear proportion) linked to summaries of each period.
- The International Commission on Stratigraphy — The home page of the people who maintain and continue to update the geologic timescale. This site includes information about the methods and terms that they use.
