
Plenty of Fish in the Sea?
Part B: Exploring Fishing Distribution Data
 Catches by Commercial groups in the Global Ocean 1950-2014 (in metric tons). Graph courtesy of Sea Around Us
Fishing Boats
According to research published in 2019, the global fishing fleet consisted of 1.7 million vessels in 1950. By 2015, the fleet had doubled. More than half of those vessels were motorized (68%). The dominant form of motorization is small powered vessels under 50kW (the size of an outboard motor); however, small powered vessels provide only 27% of the global engine power of 145GW. This indicates that while a minority of powered fishing vessels globally are large, they comprise the majority of the global engine power.
According to the UN's State of World Fisheries report, the world had an estimated 4.6 million fishing vessels in 2016.
1. Take a look at the graphs below from the UN report to learn about the global fishing vessels and answer the Checking In questions below.
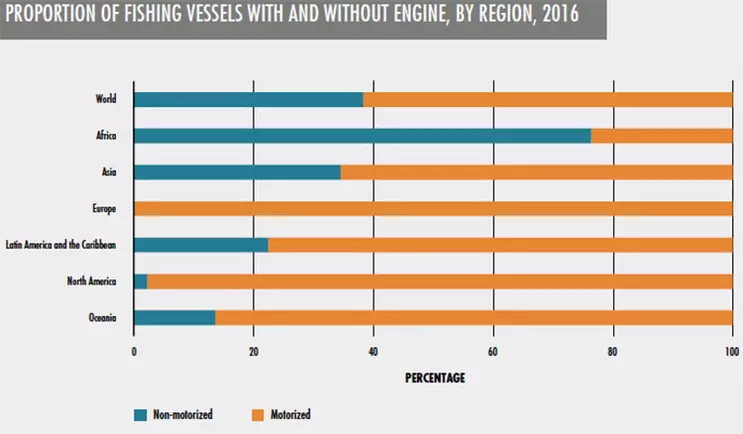 from UN FAO State of World Fisheries, 2018
 from UN FAO State of World Fisheries, 2018
 Checking In
- What regions of the world have the largest and smallest proportions of motorized fishing vessels?
- Approximately what proportion of motorized fishing vessels are there in the North American region?
- Put the regions in order from highest to lowest distribution by number of motorized fishing vessels.
Expanded Fishing
In 2014, fisheries scientists gathered as much data as they could on global fishing and used it to produce maps of the locations of global fish catches over time. These maps, part of the research initiative known as the Sea Around Us project, make it possible to track which areas of the ocean are most heavily fished, where certain species have been fished, and how countries have expanded or shifted their fishing efforts over time.
2. Visit the Sea Around Us spatial catch map on their website to view reconstructed catch data, mapped over the global oceans, from 1950 to 2014.
3. In the Catch Allocation box, select All Fishing Countries,Commercial Group , and All Commercial groups. Click the blue Update map button. (Be patient, it may take a moment to load.)

![[creative commons]](/images/creativecommons_16.png)
4. Move the date slider to see how fishing changed since 1950. You can also see the annual catch total by year just above the color key.
5. Move the date slider to 1950. Change Fishing Countries to USA. Keep the other options the same as before. Click the blue Update map button.
6. Move the date slider to see how U.S. fishing changed since 1950.
Checking In
- Approximately what year did the US first start fishing near Antarctica?
7. Move the date slider to 1950. Change Commercial Group to Tunas & billfishes. See how the catch and distribution of fishing changed for tuna and billfishes.

On the right is a map showing their global distribution.
 From Sea Around Us. Note: Bonito is a type of fish resembling skipjack tuna.
8. Repeat step 7, but change the Countries to All fishing countries. Compare the global distribution map to the new catch allocation map.
Checking In
- How has fishing of tuna and billfishes changed over time compared to their natural range?
- What was the U.S. percentage of the global catch of tuna and billfishes in 2014?
Stop and Think
1: Why do you think that the global catch maps for tuna and billfishes don't match their biological distribution map?More boats, fewer fish
As you saw, fishing has expanded globally since 1950. More fishing boats are out fishing, and more fish are being caught annually. However, studies have shown that, even with all this added effort, there are fewer fish being caught.9. Read the 2019 Science article Fishing fleets have doubled since 1950 - but they're having a harder time catching fish.
Stop and Think
2: In your own words, explain ways that fishing was able to expand globally in the years since 1950.Optional Extensions
About International Exclusive Economic Zones or EEZsResearch Article about Fishing Vessels
Fishing and the Technological Creep
Fisheries expansion impacts 90 percent of the global ocean