Hypoxia in Coastal Marine Ecosystems
Summary
Aquatic ecosystems are home to a complex intersection of physical and biological factors and an intersection of natural and anthropogenic factors. In the Chesapeake Bay, low oxygen events have occurred periodically and may be connected with harmful algal blooms, fish kills, heavy flooding/runoff events, and warming temperatures. Careful monitoring of the system by the Chesapeake Bay Program since 1984 allows scientists and policymakers to evaluate the causes of the events and monitor improvements in the health of the ecosystem.
Strengths of Module
Students will use a multi-variable 10-year data set from the Chesapeake Bay to investigate the change in dissolved oxygen concentration over time. To determine the possible cause(s) of hypoxic events, students will analyze additional variables and will need to relate and apply their understanding of natural and anthropogenic processes affecting the ecosystem. Students will support their conclusions with evidence from their analyses.
What does success look like?
Students will be able to:
- Support a conclusion using evidence and their understanding of relevant scientific concepts.
- Explain how environmental factors in aquatic ecosystems can cause hypoxic or anoxic events.
- Make connections between natural and anthropogenic processes that affect aquatic ecosystems.
- Use different data analysis techniques to quantify and/or validate the relationship between two or more variables.
Students will use appropriate and sufficient data sets and analyses of those data to support a conclusion about the cause of one or more hypoxic events. They will show their understanding of relevant scientific concepts in their reasoning, and their skills analyzing and interpreting data as evidence to support their conclusion(s).
Context for Use
This module was originally designed for use in an introductory oceanography course at Rider University, a private institution of 4000 students, with lecture size 25-30 students and lab size 12-16 students. The module is designed to take 3 hours if students have some background using spreadsheets and spreadsheet charts. Instructions are specific for use of Excel, but could be completed with other programs or graphing tools. Specific statistical analysis is not required, although some options are suggested if instructors and students are ready for such work. The module was designed to help students develop their own explanation for the hypoxic events by linking evidence with background knowledge about dead zones, fish kills, harmful algal blooms, etc.
While this activity was designed using Chesapeake Bay data, other aquatic ecosystems with time series data for oxygen, temperature, salinity, nutrients, and chlorophyll (and possibly pheophytin, particulate organic carbon (POC), or total suspended solids (TSS)) for both surface and bottom waters may be substituted. (Surprisingly, at the time of writing, the authors struggled to find other systems with all of these variables for the same location.)
For the Chesapeake Bay example included, data were downloaded from the Chesapeake Bay Program data hub at
https://www.chesapeakebay.net/what/downloads/cbp_water_quality_database_1984_present
Prior knowledge needed to complete Activities A & B:
- Basics about photosynthesis, respiration, decomposition
- Basic factors affecting plant growth (sunlight, water, nutrients)
- Biological and physical processes affecting dissolved oxygen concentration: photosynthesis, respiration, decomposition, solubility of gases, turbulence/agitation
- Properties of water that affect its density
- Stability of stratified water
- Some familiarity with Microsoft Excel will help
New learning will include:
- Phytoplankton primary production
- Decomposition in a 3-dimensional environment
- Impact of nutrient limitation and excess on primary production and decomposition
- Seasonal impacts on stratification and mixing
- Using Excel to calculate and construct data visualizations (graphs)
- Articulating trends and patterns in data
- Articulating patterns across multiple data sets
- Optional work: use of some appropriate statistical tests
How Instructors Have Used This Module
This module was featured in a webinar, which is available in the references and resources section below. You can also browse My EDDIE Experience Instructor Stories from users, provided below.
Using Project EDDIE modules in Data Science for Life Sciences
Derek Sollberger, University of California-Merced
Instructor story detailing the adaptation and implementation of the Project EDDIE "Hypoxia in Coastal Marine Ecosystems" module into an undergraduate Data Science for Life Sciences laboratory course, including pedagogical modifications, use of R programming, student outcomes, and future teaching plans, developed during a QUBES Faculty Mentoring Network. auto-generated
The author of this page didn't provide a brief description so this one sentence summary was created by an AI tool. It may not be completely accurate.
Using Project EDDIE modules in Oceanography
Sarah "Sally" Zellers, University of Central Missouri
Instructor story page detailing the implementation of the Project EDDIE "Hypoxia in Coastal Marine Ecosystems" module in an introductory undergraduate oceanography course for non-majors, including adaptations, teaching strategies, student outcomes, and educator-only supplemental materials developed through a QUBES Faculty Mentoring Network. auto-generated
The author of this page didn't provide a brief description so this one sentence summary was created by an AI tool. It may not be completely accurate.
Description and Teaching Materials
Why this Matters:
Students will develop their quantitative skills in the context of a real world issue to better understand the sensitivity of aquatic ecosystems [and fisheries] to human activity.
Quick outline/overview of the activities in this module
- Activity A: Students learn to plot time series with 2 data sets (top and bottom measurements of dissolved oxygen); and understand that parameters at the surface can vary from bottom.
- Activity B: Students do spreadsheet calculations and plot two different variables (dissolved oxygen and density) in a time series to begin to look at possible correlations.
- Activity C: Students decide on how to determine the cause of hypoxic events by plotting additional biological variables and look for correlations and manageable measures.
- Optional Activity D: Students extend their analyses of the data by completing cross correlation and Student's T-test calculations to quantify a lag time between variations in two variables in the data set provided.
- Optional Activity E: Students develop an understanding of how common the issue is around the globe, and consider natural instances of higher productivity versus anthropogenically stimulated or enhanced instances.
Teaching Materials:
- Student Handout (Microsoft Word 2007 (.docx) 1.7MB Jul19 21)
- Dataset
- Student Excel file (Excel 2007 (.xlsx) 999kB Jul19 21)
Teaching Notes and Tips
See Instructor's Manual.
Instructors should be mindful of misconceptions and student challenges such as:
- Harmful algal blooms cause fish kills only because algae are toxic.
- Water pollution is toxic chemicals or trash, not something like lawn or crop fertilizer.
- Nutrients (nitrate, phosphate) are taken up by animals as "food."
- Algae use up the oxygen in the water, causing low DO.
- Temperature or salinity changes are directly responsible for lowering DO through the effect on gas solubility.
- All water masses are the same.
- Fertilizer pollution results from overuse only (vs. overuse AND/or minimally used land exposed to continued runoff when not used for crops) https://www.ecowatch.com/theres-nothing-average-about-this-years-gulf-of-mexico-dead-zone-1891172459.html
- Be careful in the more open inquiry work for Activity C to not develop new misconceptions. See specifics in Activity C guide.
- When data are studied, students are asked in numerous places in this lab to first describe patterns and only after doing so, explain the results. We do this very intentionally to help students develop the skills to analyze data before coming to any conclusions about the data. Often students have a tendency to jump to explanations but not include any evidence to support conclusions they make.
Workflow of this module:
- Assign any pre-class readings
- Give students their handout when they arrive to class
- Instructor gives brief slide presentation with background material. Discussion of the readings can be integrated into this presentation or done before.
- Students can then work through the module activities, breaking for discussion/presentation between each part, A, B, & C.
Notes on the student handout:
Depending on how instructors would like students to record their process and answer questions, student handout may be reformatted. Current format does not include space for student written responses.
Measures of Student Success
Part A: Students' graphs will demonstrate their abilities to make spreadsheet calculations, plot a time series, and make sense of the data.
Part B: Students' summaries of the patterns and trends they observed in their graphs will reveal their abilities to interpret and articulate their observations and key in on trends and patterns that might be most relevant for the phenomenon explored.
Part C: Students' explanations will show their understanding of relevant science concepts introduced in this module (or from previous learnings) and show how they support their conclusions with evidence and reasoning.
Optional D: Students will show, in their revised explanations, how statistical analysis can quantify observations and provide additional evidence to support conclusions.
Optional E: Students' explanations will show their ability to apply their background knowledge to consider global patterns in the location of "dead zones" and the potential impact of increasing sea surface temperature (due to climate change).
Rubric provided to assess explanations: Student Assessment Rubric- Hypoxia in Coastal Marine Ecosystems.docx (Microsoft Word 2007 (.docx) 19kB Jul19 21)
References and Resources
Instructor Resources:
- Data for Chesapeake Bay downloaded to spreadsheet and cleaned from the Chesapeake Bay Program website.
- https://www.chesapeakebay.net/what/data
- Data from 2010 to 2019 provided come from station CB4.1 located in the mesohaline region of the Chesapeake Bay a few miles south of the Chesapeake Bay Bridge https://www.chesapeakebay.net/documents/3676/map_of_mainstem_and_tributary_monitoring_stations.pdf
- Data for most recent time period selected include measurements from top and bottom of water column
- Breitburg, D., Levin, L.A., Oschlies, A., Grégoire, M., Chavez, F.P., Conley, D.J., Garçon, V., Gilbert, D., Gutiérrez, D., Isensee, K., Jacinto, G.S., Limburg, K.E., Montes, I., Naqvi, S.W.A., Pitcher, G.C., Rabalais, N.N., Roman, M.R., Rose, K.A., Seibel, B.A., Telszewski, M., Yasuhara, M., Zhang, J. , 2018, Declining oxygen in the global ocean and coastal waters, Science 359: 46, 11 pp. ISSN 1095-9203 https://science.sciencemag.org/content/359/6371/eaam7240
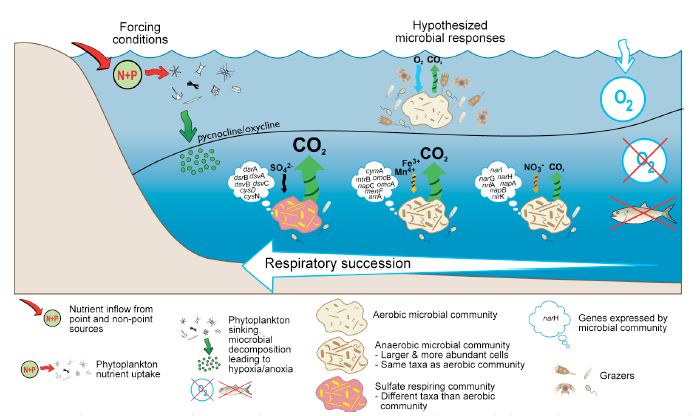
- Byron Crump, N.D., Life in the Dead Zone: Respiratory succession in anoxic waters of a stratified estuary, Oregon State University, http://www.people.vcu.edu/~dylee/images/LDZ_concept.png
- Cerco, C.F. 2000, Phytoplankton Kinetics in the Chesapeake Bay Estuary Model Technical Report. January, 2000. Chesapeake Bay Program Office, Annapolis, MD. https://www.chesapeakebay.net/content/publications/cbp_13014.pdf - Publications Tab. Date Retrieved: 7/8/2021.
- Dunkle, A., 2015, Seekonk sees second fish kill of summer 2015 https://web.uri.edu/rinsfepscor/2015/08/05/seekonk-sees-second-fish-kill-of-summer/
- Kidwell, D.M., Lewitus, A.J., Brandt, S., Jewett, E.B., Mason, D.M., Ecological impacts of hypoxia on living resources, Journal of Experimental Marine Biology and Ecology 381 Supplement: S1-S3. https://doi.org/10.1016/j.jembe.2009.07.009
- Kyd, C., 2020, Use Automated Cross Correlations in Excel to Find Leading Indicators—Part 1, Excel User.com. https://exceluser.com/1069/use-automated-cross-correlations-in-excel-to-find-leading-indicators-part-1/
- Selman, M., 2013, Eutrophication & Hypoxia Map Data Set, World Resources Institute data set, https://www.wri.org/resources/data-sets/eutrophication-hypoxia-map-data-set
- Selman, M., Sugg, Z., Greenhalgh, S. & Diaz, R., 2008, Eutrophication and Hypoxia in Coastal Areas: A Global Assessment of the State of Knowledge, World Resources Institute Policy Note, Water Quality: Eutrophication and Hypoxia No. 1, ISBN 978-1-56973-681-4. https://www.wri.org/publication/eutrophication-and-hypoxia-coastal-areas
- View the November 12, 2021, Helping students critically evaluate data webinar, featuring how this module was used: Click to view or download the webinar recording (MP4 Video 235.6MB Nov15 21).
Related EDDIE Modules
- Harmful Algal Blooms (HABs) in Freshwater(coming soon)
- Nutrient Monitoring in the Chesapeake Bay (coming soon)
- Paleoclimate and Ocean Biogeochemistry