Example Simulations
If you are just getting started using WILSIM-GC, it may be helpful to run a couple of example simulations, to familiarize yourself with the model and its capabilities. Here are a few options you might try. For more in-depth instructions, several exercises are available on the Teaching Activities page.
Use Default Parameter Values and Change Your Viewing Perspective

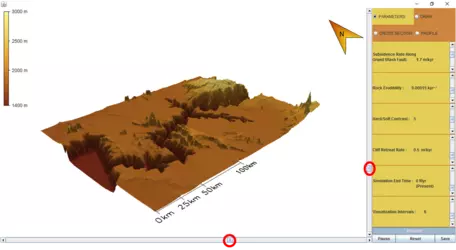
Follow the instructions on the Start Using WILSIM-GC page to setup the model; leave all of the parameters at the default values and click on the "Start" button. Watch the Grand Canyon develop. In particular, pay attention to the migration of the knickpoint: the point on the Colorado River where it begins to cut down into the stratigraphy of the canyon.
These default values were chosen because they will result in the development of a canyon that has a morphology, or form, similar to the Grand Canyon.
Experiment with these options:
- You can use the slider bars at the bottom and right sides of the main screen to change your viewing perspective.
- To pause the simulation, click on "Pause;" to continue the simulation, click on "Continue." (The button toggles between Pause and Continue upon clicking).
- To start a different simulation, or to begin this one again, you don't have to wait until this one ends and begin again. Just click on the "Reset" button. The "Pause/Continue" button will change to "Start," and you can start a new simulation.
Long Profile Graphs

![[creative commons]](/images/creativecommons_16.png)
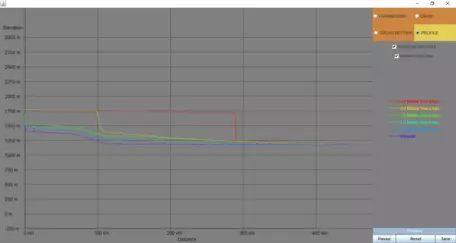
At the end of the simulation, a long profile graph can be viewed under the "Profile" tab in the upper right corner of the model. A long profile shows elevation changes along the length of the Colorado River, within the Grand Canyon.
- The variable that controls how often data is stored is the "Visualization Interval." Note that the default value for this variable is 1, meaning that data will only be stored once during a simulation (at the end of the simulation). Thus, the only profile that is available when the Visualization Interval = 1 is the profile for canyon geometry at the end of the simulation. To compare profiles at additional time intervals, change the value of the Visualization Interval. For example, if you set the value of the Visualization Interval to 6, it will save profile data every million years (at 6 equal intervals over the 6 million year simulation).
Cross-Sections Graphs
Another way to look at canyon morphology is by selecting a cross section through the canyon as it develops. A cross section is a vertical slice. WILSIM-GC can show you cross sections through the canyon in any location. Here's how:
- Click on the "Draw" tab.
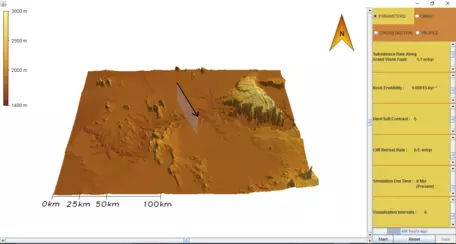
- The animation window will change to a bird's eye view. Use your mouse to click and drag a line where you want the cross section cut. The line of the cross section is shown as an arrow, as in the image below, left.
- Click on the "Parameters" tab. The animation window will revert to your most recent perspective view, as shown below, right, with the location of your cross section shown as a semi-transparent plane.

- Click on Start (or Reset and then Start if you have run a previous simulation).

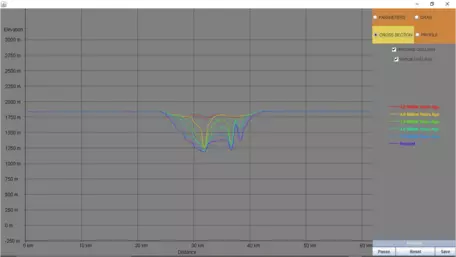
- At the end of the simulation, click on the "Cross Section" tab to view the topographic changes along the cross section. Just as with long profiles, if your Storage Interval = 6, you'll have data for 6 cross-sections, one every million years, as shown in the image to the right.
Use a Higher Erodibility Value
Suppose you would like to know what the Grand Canyon would look like, and how it would have developed, if the rocks that form the canyon walls were easily eroded (in essence, "softer"). In that case, you could adjust the "erodibility" of the rocks in WILSIM-GC and see how that affects the canyon.
- Drag the slider bar for "Rock Erodibility" down. For example, you might choose a value of 0.2 kyr-1. That's a rate of 0.2 per thousand years. A rock erodibility factor of 0.1 kyr-1 generates erosion at a rate equal to 0.1 meter per thousand years, for a fluvial channel of slope equal to 1 (45°) and drainage area equal to 1 square kilometer. A rock erodibility factor of 0.2 kyr-1 generates erosion twice as fast as that.
- Click the "Start" button (or "Reset" and then "Start," if you have already run another simulation).
- Notice how the canyon morphology differs from the one that develops with the default values.


