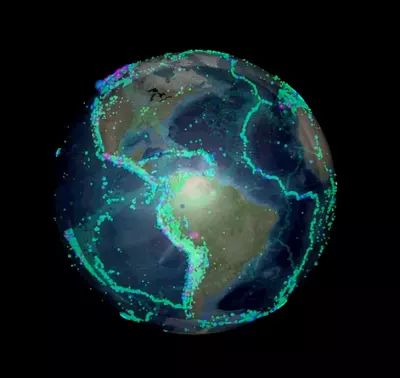
Global Earthquakes: Teaching about Earthquakes with Data and 3D Visualizations
Cara Harwood
, University of California, Davis
Author ProfileKeckCAVES (Center for Active Visualization in Earth Sciences) , & Geology Department
Summary
In this series of visualizations and accompanying activities, students visualize the distribution and magnitude of earthquakes and explore their distribution at plate boundaries. Earthquakes are visualized on a 3D globe, making it easy to see their distribution within and below Earth's surface without having to mentally transform and interpret symbols that indicate earthquake magnitude and hypocenter depth.
Context
Audience
Introductory-level undergraduate earth science class, although talking points could be adapted for younger students by giving more background.
Skills and concepts that students must have mastered
Students should understand what earthquakes are and what causes them. Students should also understand how plates move relative to each other at the three types of plate boundaries (convergent, divergent, transform). These concepts could be introduced immediately prior to this activity.
How the activity is situated in the course
This a series of visualizations in a unit about plate tectonics, although each visualization could also be used in isolation.
Three visualizations and accompanying activities are included:
Goals
Content/concepts goals for this activity
Students will understand the following concepts:
- The distribution and characteristics of earthquakes are directly related to the location and type of plate tectonic boundaries.
- Different types of plate boundaries result in different magnitudes and distributions of earthquakes.
- (Also refer to concept goals for each activity and visualization).
Higher order thinking skills goals for this activity
Students will be able to:
- Synthesize large data sets to recognize naturally occurring patterns
- Use patterns in data sets to make predictions about the distribution and characteristics of earthquakes
- Visualize data in 3D that is traditionally represented in 2D
Other skills goals for this activity
Description of the activity/assignment
This module series is designed to teach introductory-level college-age geology students about the basic processes and dynamics that produce earthquakes. Students learn about how and why earthquakes are distributed at plate boundaries using 3D visualizations of real data. These 3D visualizations were designed to allow students to more easily visualize and experience complex and highly visual geologic concepts. 3D visualizations allow students to examine features of the Earth from many different scales and perspectives, and to view both the space and time distributions of events. For example, students can view the earth from the perspective of the entire solar system, or from one point on the Earth's surface, and can visualize how earthquakes along a fault occur through time. By teaching about earthquakes and plate tectonics using a real data set that students can visualize in three-dimensions, students learn how scientists analyze large data sets to look for patterns and test hypotheses. At the end of this module students will understand how earthquakes are distributed on Earth, and how different types of plate boundaries result in different magnitudes and distributions of earthquakes.
Determining whether students have met the goals
'Quakes Questions' throughout each activity are short-answer questions that students answer while the visualization is playing to ensure that they are taking away key concepts. These questions require students to synthesize ideas and articulate their understanding of concepts introduced in the visualization.
More information about assessment tools and techniques.Teaching materials and tips
- Teaching materials can be found on each of the individual activity pages:
Visualizing Global Earthquakes – Where and Why do Earthquakes Occur?
Visualizing Earthquakes at Convergent Plate Margins
Visualizing Earthquakes at Divergent Plate Margins
Other Materials
Supporting references/URLs
The visualization software used to create this visualization is freely available and can be downloaded from http://keckcaves.org/education/.
In addition to playing back the visualizations available here, instructors can also download the visualization software and data sets and explore it themselves. Download the software and quick-start guide to begin exploring your own data sets in your classroom.


