
Part 3: Measuring and Graphing Tree-Ring Width at Chaco Canyon, NM.
 In the deserts of the American Southwest, a consistent source of water means the difference between life and death. Courtesy J. Lockwood
In addition to calendar dating ancient archeological sites, and more recent antiques and musical instruments like violins, tree rings capture a wealth of information regarding past temperature and precipitation in a region. Wet years in a region, that perhaps brought floods, and dry years, that brought drought conditions, stand out in the tree-ring record. This is particularly true in arid regions like the deserts of the US Southwest where available summer rainfall is the prime factor in determining the rate of growth of the trees in that region. In Part 2, you used a qualitative method to produce a skeleton plot and aligned your tree-ring data with a historical skeleton plot produced by Warren in 1971. In this activity, you will use a quantitative method to measure the rings of the same sample that comes from room 162 from Pueblo Bonito, to produce a time-series graph of tree-ring data. You will be using some of the same procedure followed by dendrochronologists that go on to build extensive chronologies in order to evaluate paleoclimatea climate prevalent at a particular time in the geological past in different regions of the world. Did an extreme period of drought force the Ancestral Pueblo people to leave their home, or might there be a different reason for the abandonment of the village? Tree-ring records help to solve this mystery.
Instructions
1. Right click on ImageJ and open it in a new window. Download the "all platforms" version here if you haven't downloaded the program yet.
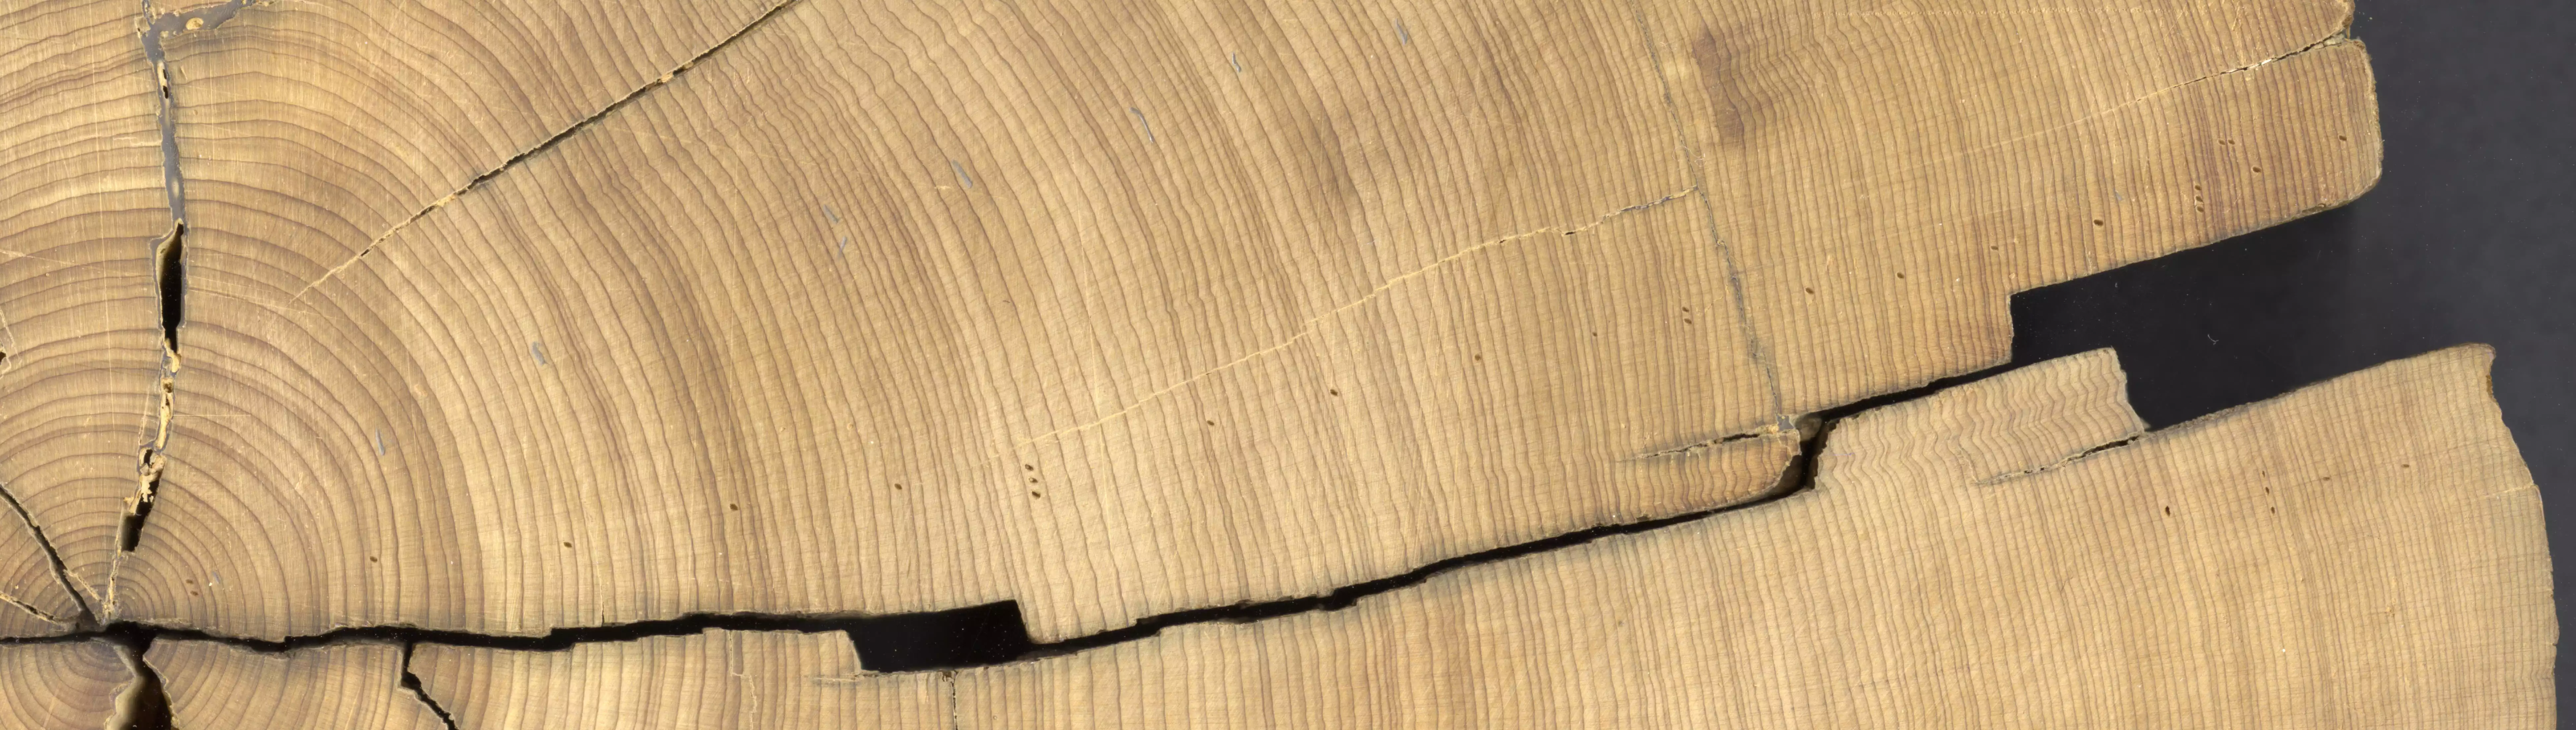
2. Download the mpb31 specimen with dates image. The two dots closest to the center of the sample marks the date 750 AD. Scientists place one mark per decade (760, 770, etc), two marks per 50 years (750, 850, etc) and three marks at the century mark (800, 900, etc). Open the image into ImageJ (File/Open).
3. Click on the straight line measuring tool. Draw a line from the center of the left-hand edge of the core sample, parallel to the reference dots, to the right-hand edge of the sample (the bark). Note: If you would like to see an example of how to measure in ImageJ, watch the first portion of the ImageJ tutorial.
4. Go to the Analyze Menu/Set Scale. The length of the line you drew should be displayed. Enter the known distance, which is 116 mm. Set the unit to "mm." The scale of the image should now be displayed. (Alternatively, if you open Analyze Menu/Set Scale when you first open the image, the resolution in dpi, or dots per inch, of the scanned image should be listed—for example, 2400 dpi. To change the scale to 0.01 mm, simply divide the scanned resolution by 2540, write that value in the Distance in pixels box, and change the Unit of length to 0.01 mm.) Be sure to save the scanned image.
 'The set scale box'.
 5. You will be given a section of the image to study. Choose the magnifying glass icon and zoom in on the decades in your assigned sample. Since the rings are narrow, it will make measuring easier if you work on just 10 years/rings at a time.
6. Go to Analyze/Set Measurements and make sure Perimeter is checked—You can remove area or any other measurements checked (Perimeter sets the line tool to measure distances).
 'Measuring tree ring widths'.
 7. Click on the straight line tool. Draw a line across the first tree ring in your sample. Make sure the line is perpendicular to both sides of the ring. See illustration at the right. Hit "Command M" (or Control M on a PC). The width of the ring will be displayed in a results box.
NOTE: An alternative is to make sure Analyze Menu/Set Measurements/Add to overlay is checked. This setting allows you to simply hit the M key to measure. Additionally, the following macro, when saved as a text file and loaded through Plugins/Macro/Install allows you to choose Z ( or any key) to measure and an option to keep your right hand on the mouse:
macro "measring [z]" {
run("Measure");
run("Label");}
8. Measure each tree-ring width in your sample in succession from the inward most ring toward the outside. Re-position the straight line measuring tool each time to measure with a line perpendicular to both sides of the ring. You do NOT have to follow the line of marked dots. You will have to de-magnify several times and re-position your image with the hand tool several times to complete your table. You can select the Window menu and select "Results' to make the table visible as you work.
9. Save your measurement table to your desktop. Change the ring numbers to dates (i.e. 770, 771, 772, etc.). Give/send your results to your instructor. A class table for the entire tree-ring section will be produced. Then paste your table into worksheet
10. You will be directed by your instructor as to the method you will use to graph your results. When you are finished plotting the class data, look for regions of the graph that show small ring widths (that represent drought conditions) over one or more years. Note: Your analysis is based on a single sample. Dendrochronologists would take cores from 20 to 30 trees or more, and several cores from each tree. Then they would quality check all samples before combining the data to do a scientifically valid analysis.
11. The data you derived was 'raw', i.e. it hasn't been processed to removed growth patterns that are related to how a tree grows over time, called age-trendsa pattern of tree ring widths that result from early tree rings tending to be wider than later growth tree rings. The growth ring of a very young tree is spread over the small diameter of the tree and is proportionally larger than the ring you observe in trees that are much older that have the growth ring spread over a larger diameter tree. You may have noticed how large the rings in the first ten years of growth in your sample were compared to the last ten years. Scientists have to address age-trends when they build tree-ring chronologies. A statistical process, called detrending the process of removing the effects of a bias trend in the data to show only the absolute changes in tree-ring width that allows potential cyclical patterns in tree rings to be identified, is done on the raw data to account for these changing patterns. We won't be detrending cores in this lab. You will evaluate a tree-ring reconstruction, where age trends have been removed, in Part 4 of this lab.
Stop and Think
3.1 Copy and paste the graph that you created of sample mpb31 from Pueblo Bonito, Chaco Canyon.