
Real world problem translating to a logistical sequential algorithm aligned with Chemistry and Biomedical study in the classroom and/or laboratory.
Summary
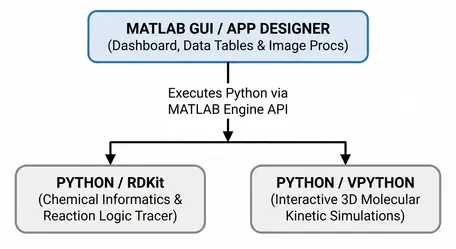
Students in Chemistry lecture or laboratories in person (or asynchronous) in both lower and upper classes without knowing how the fundamental concepts, including hands-on activity correlate with theory, which puts students behind and struggling for the class and/or not preparing for the class. In this instance, I intend to code an application to supplement student learning, not just by doing hands-on-activity but by understanding what is done by translating to logic. An architecture uses MATLAB, Python (with RdKit, V-Python) to build an interactive educational application designed to bridge the gap between mathematical/chemical logic and real-world observations.

 Collapse
Learning Goals
Students will be able to:
- study the fundamental concepts of chemistry related to math.
- construct the program/coding to analyze and/or translate the logical reason and supplement learning.
- observe, quantify and calculate data as an interactive application in a table or graph and processing photos or images amplifies relevance.
Context for Use
This interactive classroom and laboratory curriculum is designed for Intro-level chemistry courses at universities with a maximum capacity of 50 students. The course structure spans short 10-minute micro-practices up to comprehensive 2-to-3-hour laboratory sessions, integrating Python (with RdKit, V-Python) and MATLAB onramp.
Description and Teaching Materials
Chemical Reactions: Physical/Chemical Changes
In this exercise, you will test the physical and chemical changesby performing a variety of chemical reactions and observing the changes that take place.
Procedure:
1. Open the app by clicking on the link below:
CLICK HERE or the following to launch the App -
https://virtual-physical-chemical-change-lab-jfz4nduym8o6n653a9xmew.streamlit.app/
Note: If the link does not appear to be responding, ensure that pop up blockers have been disabled in your browser and if app is sleeping click to wake up.
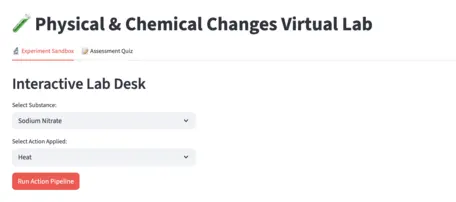
The following new window should be appearing on the screen:
_ _ _ __ _ _ __ _ _ __ _ _ __ _ _ __ _ _ __ _ _ __ _ _ __ _ _ __ _ _ __ _ _ __ _ _ __ _ _ __ _ _ __ _ _ _
_ _ _ __ _ _ __ _ _ __ _ _ __ _ _ __ _ _ __ _ _ __ _ _ __ _ _ __ _ _ __ _ _ __ _ _ __ _ _ __ _ _ __ _ _ _
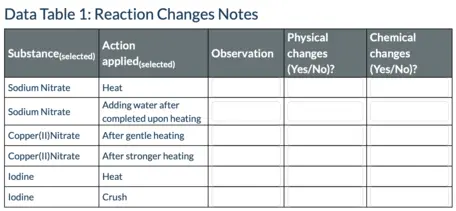
2. Under Interactive Lab Desk & Experiment Sandbox choose substance under "Select Substance" and action under "Select Action Applied " and click on Run Action Pipeline. Then play the video should be appearing at the bottom of the page. Observe any changes and record in Data Table 1 using the following conventions:
Color change: If the contents of the test tube have changed color but still appear transparent, a color change may have occurred. Record Chemical Changes.
If nothing has occurred visually or physical state change, record Physical Changes.
Note: If you are unsure what changes re-watch the video. Complete Data Table 1 with selecting each substance and action
3. Before launch following Chemistry simulation take an assessment yourself by clicking on "Assessment Quiz" on the right of the "Experiment Sandbox".
4. Then Open the app by clicking on the link below to launch Chemistry simulation: Physical & Chemical Changes :
CLICK HERE or the following to launch the App -
https://3dphychem-vfhvnd7pt3ucugw68xnghu.streamlit.app/
Note: If the link does not appear to be responding, ensure that pop up blockers have been disabled in your browser and and if app is sleeping click to wake up..
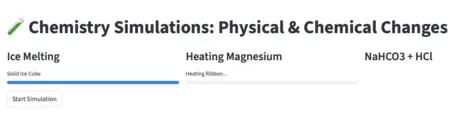
The following new window should be appearing on the screen:
_ _ _ __ _ _ __ _ _ __ _ _ __ _ _ __ _ _ __ _ _ __ _ _ __ _ _ __ _ _ __ _ _ __ _ _ __ _ _ __ _ _ __ _ _ __ _ _ _
_ _ _ __ _ _ __ _ _ __ _ _ __ _ _ __ _ _ __ _ _ __ _ _ __ _ _ __ _ _ __ _ _ __ _ _ __ _ _ __ _ _ __ _ _ __ _ _ _
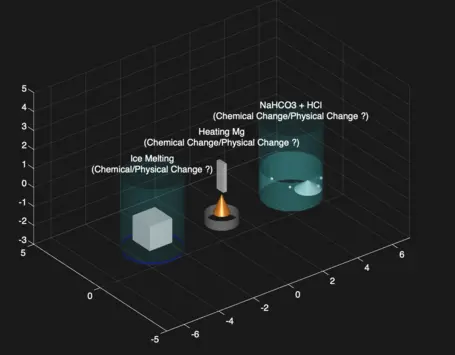
MATLAB Live Script for Simulation:
 chemistry_simulations.m -- educator-only file
 Hide
_ _ _ __ _ _ __ _ _ __ _ _ __ _ _ __ _ _ __ _ _ __ _ _ __ _ _ __ _ _ __ _ _ __ _ _ __ _ _ __ _ _ __ _ _ __ _ _ _
_ _ _ __ _ _ __ _ _ __ _ _ __ _ _ __ _ _ __ _ _ __ _ _ __ _ _ __ _ _ __ _ _ __ _ _ __ _ _ __ _ _ __ _ _ __ _ _ _
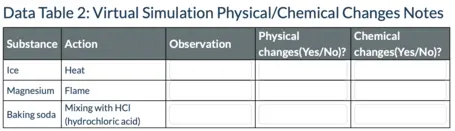
5. Click on "Start Simulation" to perform the experiment. Observe any changes and record in Data Table 2 using the following conventions:
Color change: If the contents of the test tube have changed color but still appear transparent, a color change may have occurred. Record Chemical Changes.
If nothing has occurred visually or physical state change, record Physical Changes.
Data Table 1: Reaction Changes Notes
_ _ _ __ _ _ __ _ _ __ _ _ __ _ _ __ _ _ __ _ _ __ _ _ __ _ _ __ _ _ __ _ _ __ _ _ __ _ _ __ _ _ __ _ _ __ _ _ _
_ _ _ __ _ _ __ _ _ __ _ _ __ _ _ __ _ _ __ _ _ __ _ _ __ _ _ __ _ _ __ _ _ __ _ _ __ _ _ __ _ _ __ _ _ __ _ _ _
Data Table 2: Virtual Simulation Physical/Chemical Changes Notes
_ _ _ __ _ _ __ _ _ __ _ _ __ _ _ __ _ _ __ _ _ __ _ _ __ _ _ __ _ _ __ _ _ __ _ _ __ _ _ __ _ _ __ _ _ __ _ _ _
_ _ _ __ _ _ __ _ _ __ _ _ __ _ _ __ _ _ __ _ _ __ _ _ __ _ _ __ _ _ __ _ _ __ _ _ __ _ _ __ _ _ __ _ _ __ _ _ _
Teaching Notes and Tips
- Interactive application/app
- make sure that app is active and update/tweak the script.
Assessment
Classroom and simulation practices. Table 1 and Table 2 will be submitted through the Canvas for grading, in which Table 1 will be graded 60 Pts (for each reaction 10 pts.)., Table 2 will be graded 40 (for each simulation 13 pts) Pts as a total of 100 Pts.
References and Resources
https://www.rdkit.org
https://www.glowscript.org/docs/VPythonDocs/index.html
https://pubchem.ncbi.nlm.nih.gov/