Using Models in Economics
Introduction
Models are simplified representations of complicated ideas that allow economists to analyze the complex economy.

![[creative commons]](/images/creativecommons_16.png)
Provenance: By NASA Ames Research Center [Public domain], via Wikimedia Commons
Reuse: This item is offered under a Creative Commons Attribution-NonCommercial-ShareAlike license http://creativecommons.org/licenses/by-nc-sa/3.0/ You may reuse this item for non-commercial purposes as long as you provide attribution and offer any derivative works under a similar license.
When aircraft engineers build new airplanes they test models in wind tunnels. Airplanes are highly complex. Even though a model is a simplified representation of the real thing, it is still useful for understanding how a real plane will fly.
In economics, we use different types of models to understand complexities:
How do we use models in economics?
Step 1: Identify the key variables that will be used
Step 2: Identify variables that will not be included. This is a concept called ceteris paribus.
The ceteris paribus (pronounced like "Setter-is pair-a-bus") assumption means "all other things being equal" or "all other things held constant." It means that we are analyzing cause-and-effect while assuming that other variables are held constant.
Let's use textbooks as an example. How does an increase in the price of a good (the textbooks in this case) affect the quantity of that good that consumers will purchase? Using the ceteris paribus assumption: An increase in the price of new college textbooks will cause a decrease in the quantity of textbooks demanded, assuming all else is equal.
Ceteris paribus means that we are holding other factors constant (essentially, ignoring them for the time-being) including income and the price of alternatives such as second-hand books. We do this for the sake of clarity. If we were not holding other factors constant, we wouldn't know if the quantity demanded changed because of a change in price (what we want to study), or because of other factors, such as income or the price of used textbooks.
Step 3: Find out how the variables interact. This will help us select an appropriate model.
- Which variables are related which other variables?
- How do they relate to each other?
(Learn more about variables and parameters)
Where are models used in Macroeconomics?
- The Circular Flow Model is a diagrammatic model that shows how resources in an economy move between households, businesses and government.

![[reuse info]](/images/information_16.png)
Provenance: US Government
Reuse: This item is in the public domain and maybe reused freely without restriction.
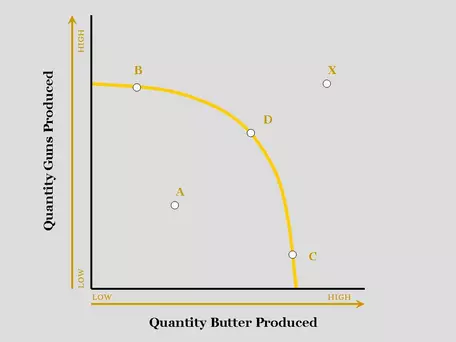
- The Production Possibilities Model is a graphical model that shows different combinations of two goods that can be produced in an economy with the available resources and technology.
PPF
Provenance: Wikipedia
Reuse: This item is offered under a Creative Commons Attribution-NonCommercial-ShareAlike license http://creativecommons.org/licenses/by-nc-sa/3.0/ You may reuse this item for non-commercial purposes as long as you provide attribution and offer any derivative works under a similar license.
- The Aggregate Supply/Aggregate Demand Model (AS/AD) is a graphical model representing the relationship between buyers and sellers in an economy.

Provenance: Wikipedia
Reuse: This item is offered under a Creative Commons Attribution-NonCommercial-ShareAlike license http://creativecommons.org/licenses/by-nc-sa/3.0/ You may reuse this item for non-commercial purposes as long as you provide attribution and offer any derivative works under a similar license.
- A Production Function is a mathematical model that shows how output is related to capital and labor.

Provenance: Wikipedia
Reuse: This item is offered under a Creative Commons Attribution-NonCommercial-ShareAlike license http://creativecommons.org/licenses/by-nc-sa/3.0/ You may reuse this item for non-commercial purposes as long as you provide attribution and offer any derivative works under a similar license.
- A Consumption Function is a mathematical model that shows how purchases of goods and services depend on income, wealth, expectations and prices.

PF
Provenance: Wikipedia
Reuse: This item is offered under a Creative Commons Attribution-NonCommercial-ShareAlike license http://creativecommons.org/licenses/by-nc-sa/3.0/ You may reuse this item for non-commercial purposes as long as you provide attribution and offer any derivative works under a similar license.
Where are models used in Microeconomics?
-
The Supply and Demand Model is a graphical and/or mathematical model of the relationship between the price of a good or service and the quantities buyers demand and sellers supply.
This is arguably the most important model in economics!

Provenance: Wikimedia
Reuse: This item is offered under a Creative Commons Attribution-NonCommercial-ShareAlike license http://creativecommons.org/licenses/by-nc-sa/3.0/ You may reuse this item for non-commercial purposes as long as you provide attribution and offer any derivative works under a similar license.
- The Model of Perfect Competition is a set of assumptions and graphical models that shows how firms will behave under highly competitive conditions.

Provenance: Wikimedia
Reuse: This item is offered under a Creative Commons Attribution-NonCommercial-ShareAlike license http://creativecommons.org/licenses/by-nc-sa/3.0/ You may reuse this item for non-commercial purposes as long as you provide attribution and offer any derivative works under a similar license.
- The Monopoly Firm Model is a graphical model that shows price and output behavior of firms that dominate a market.

Provenance: Wikimedia
Reuse: This item is offered under a Creative Commons Attribution-NonCommercial-ShareAlike license http://creativecommons.org/licenses/by-nc-sa/3.0/ You may reuse this item for non-commercial purposes as long as you provide attribution and offer any derivative works under a similar license.
- The Budget Line Model is a graphical model that shows combinations of two goods that are affordable to a consumer given the consumer's income and the prices of the two goods.
The budget line model can be used to show how a change in price(s) or income will lead to predictable outcomes for the consumer. For this we rely on the ceteris paribus assumption.
For example, suppose that Johnny is given a weekly allowance of $30 to spend on lunch and gasoline. The price of each lunch is $6, and the price of each gallon of gasoline is $3. A model of what Johnny is able to purchase is shown below.

Figure A
Provenance: Peter Schuhmann, University of North Carolina Wilmington
Reuse: This item is offered under a Creative Commons Attribution-NonCommercial-ShareAlike license http://creativecommons.org/licenses/by-nc-sa/3.0/ You may reuse this item for non-commercial purposes as long as you provide attribution and offer any derivative works under a similar license.
If Johnny's allowance was to increase to $60, his budget line would shift out and to the right. Ceteris paribus, Johnny's new budget line would be:

Provenance: Peter Schuhmann, University of North Carolina Wilmington
Reuse: This item is offered under a Creative Commons Attribution-NonCommercial-ShareAlike license http://creativecommons.org/licenses/by-nc-sa/3.0/ You may reuse this item for non-commercial purposes as long as you provide attribution and offer any derivative works under a similar license.
We must assume that no other factors are changing in order to arrive at this conclusion because other factors (such as an increase in the price of the goods) could offset the effect of the change in Johnny's allowance. Without the ceteris paribus assumption, we would have a harder time isolating --- and then modeling --- the impact of income on a consumer's consumption possibilities.
✓ Final thoughts on economic modeling
Good models don't have to be "realistic". In fact, realistic models may be too complex to be useful. Instead, models should be plausible, informative and lead to good predictions.
- The benefit of using economic models is that they allow us to simplify complex situations. Indeed, without models, understanding relationships between economic variables would be difficult.
- The downside of using models is that the conclusions we draw may not hold true when the simplifying assumptions around which the model is built do not hold up in reality.


