Erosion in a River
Summary

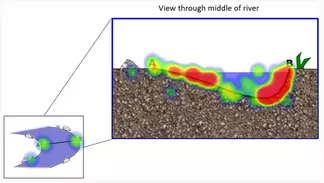
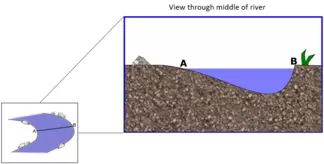
Students are shown these diagrams and instructed to "Click in the river where you expect to find the greatest rate of erosion along the river bed."
A follow-up question asks students to "Click in the river where you expect to find the fastest moving water."
Context
Audience
Students in an introductory-level geoscience course.
Skills and concepts that students must have mastered
Students need to know where the fastest current will be in a river.
How the activity is situated in the course
This activity is used as a formative assessment following a lecture or activity about sediment transport in rivers. Displaying the results after administering the question provides students and instructor immediate feedback about how well students understand velocity and erosion in a river.
Goals
Content/concepts goals for this activity
The goals of this activity are:
- to evaluate how well students recognize the relationship between velocity and erosion patterns in a river (conceptual goal)
- to engage students in predicting where erosion will occur to test their mental models of fluid dynamics (spatial skill)
Higher order thinking skills goals for this activity
Students will make a spatial prediction, receive feedback, and modify their prediction based on the feedback.
Skills goals for this activity
Not applicable
Description and Teaching Materials

![[reuse info]](/images/information_16.png)

Science of Learning: Why It Works
There is accumulating evidence that engaging in spatial prediction and receiving feedback about the nature of one's errors leads to improved spatial reasoning (Gagnier et al. 2017; Resnick et al., 2017). Making a prediction, receiving feedback, and learning from the mismatch between the expected and actual outcomes is a process studied in cognitive science called the delta-rule model of learning (Rescorla and Wagner, 1972). Modern models of learning from the education research literature focuses on Piaget's concept of accommodation, where people will adjust their mental models as a consequence of the the feedback (Dole and Sinatra, 1998). Examples from research on geology concepts show us that students' build more scientifically accurate mental models after engaging in prediction and feedback. Gagnier et al. (2017) engaged students in making predictions about the interior of a geologic structure using block diagrams. The cycle of prediction and feedback facilitated students improved performance on a test of penetrative thinking. Resnick et al. (2017) engaged students in making predictions about the geologic time scale using a classroom response system (clickers). Students answered multiple-choice questions about the position of geologic events on a typical diagram of the geologic time scale. The spatial prediction clicker questions were as effective as, and more efficient than a hands-on meter stick activity at building a scientifically accurate linear conception of geologic time. Building on this research, we propose that the technique described below is a useful approach to identify students' spatial conceptions associated with various geologic phenomena (LaDue et al., 2021; LaDue and Shipley, 2018).
Teaching Notes and Tips
I use this activity to assess student understanding immediately after lecturing about fluid dynamics and sediment transport in meandering river systems. After using this in the classroom, I realized that it would be useful to contextualize students' answers to erosion in a river bend with how they imagine velocity and erosion in a straight river channel. The straight river channel diagram assigned along with the river bend diagram was a common instrument pairing in our studies. After further study, discussion amongst experts, and interviews with students, the cross-sectional views were added to the plan-view diagrams. These were also added to check that overall understanding of river erosion wasn't an artifact of the diagrams themselves. In the river bend questions with the cross-sectional view we see the persistent error pattern of students thinking the water will be moving the fastest with the greatest erosion on the inside of the bend.


Assessment
This question is useful for students to self-assess where their answer fits relative to other students in the class. Top Hat displays student responses in a heat map image that highlights the most common answers. In most systems it is possible to designate a region for the correct answer, but receiving a right-wrong answer is likely less useful than engaging students in peer discussion if the students' responses do not converge on one region.
References and Resources
Resources: There are several systems that offer click-on-diagram questions. The one we use is: https://tophat.com
References
Beatty, I. D., & Gerace, W. J. (2009). Technology-enhanced formative assessment: A research-based pedagogy for teaching science with classroom response technology. Journal of Science Education and Technology, 18(2), 146-162.
Dole, J. A., & Sinatra, G. M. (1998). Reconceptalizing change in the cognitive construction of knowledge. Educational psychologist, 33(2-3), 109-128.
Gagnier, K. M., Atit, K., Ormand, C. J., & Shipley, T. F. (2017). Comprehending 3D diagrams: Sketching to support spatial reasoning. Topics in cognitive science, 9(4), 883-901.
LaDue, N. D., Ackerman, J. R., Blaum, D., & Shipley, T. F. (2021). Assessing Water Literacy: Undergraduate Student Conceptions of Groundwater and Surface Water Flow. Water, 13(5), 622.
LaDue, N.D. and Shipley, T.F. (2018). Click-on-Diagram Questions: A New Tool to Study Conceptions using Classroom Response Systems. Journal of Science Education and Technology, 27(6), 492-507.
Rescorla, R. A., & Wagner, A. R. (1972). A theory of Pavlovian conditioning: Variations in the effectiveness of reinforcement and nonreinforcement. Classical conditioning II: Current research and theory, 2, 64-99.
Resnick, I., Newcombe, N. S., & Shipley, T. F. (2017). Dealing with big numbers: Representation and understanding of magnitudes outside of human experience. Cognitive science, 41(4), 1020-1041.