Volcano Monitoring with GPS: Westdahl Volcano Alaska
Summary
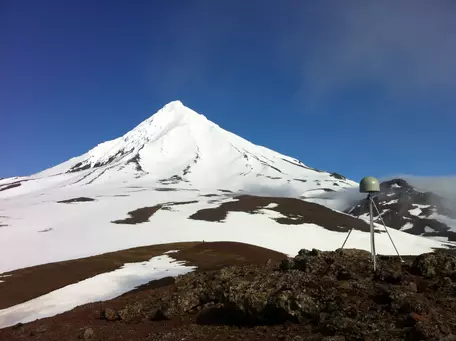
Learners use graphs of GPS position data to determine how the shape of Westdahl Volcano, Alaska is changing. If the flanks of a volcano swell or recede, it is a potential indication of magma movement and changing pressures below ground. GPS can measure changes as little as a couple millimeters per year. Learners are asked to decide if the measured motions are enough to issue a warning of immediate danger.
Context
Audience
Skills and concepts that students must have mastered
It is better if learners have at least some familiarity with plate tectonics and volcanoes. If they have none, than a brief introduction to the topic should be done. In math learners should be familiar interpreting graphs, drawing vectors, and using the Pythagorean theorem.
How the activity is situated in the course
If this is done in a class, this activity would probably be best midway or late in a unit on geoscience and hazards. Two other activities that pair well with this one are "We Need All the Assistance You Have..." and Measure a Changing Volcano.
Goals
Content/concepts goals for this activity
Learners should be able to
- Describe how the surface of a volcano is measured to understand what is happening below ground.
- Interpret GPS time series graphs
- Calculate velocity vectors from GPS time series and draw them correctly
Higher order thinking skills goals for this activity
- Analyze data sets
- Compare results
- Formulate explanations of the data
Skills goals for this activity
Working in groups
Description and Teaching Materials
Organization ideas
These materials can be presented in a variety of ways. This activity pairs really well with the interactive demonstration Measure a Changing Volcano, which uses a balloon inflating and deflating balloon under sand as an analog for an inflating-deflating magma chamber that causes the surface of the volcano to expand outwards or sink back towards the volcano's center, depending on the magma movements below ground.
You may choose to start with this demonstration as a way to peak learner interest (this could be particularly affective in an informal setting). Then you could move on to at least some elements of the provided presentation and finally having the learners do the GPS data analysis.
In a classroom, you might choose to start with the provided presentation. You could then move on to the GPS data analysis exercise. After the learners have worked with the data and found some results, playing with the interactive Measure a Changing Volcano can help them gain an intuitive feel for what they observed in the data.
Presentation
Gives background on volcanoes in Alaska, volcanic monitoring, and GPS data. The pptx is fairly extensive. Edit as works best for your learners.
Presentation: Volcanic Monitoring with GPS--An Alaskan Example (PowerPoint 2007 (.pptx) 34.3MB Jun3 20)
Supporting Animations: Volcanic Monitoring (Zip Archive 12.1MB May26 18)
Running the GPS data exercise
The GPS data exercise part of this activity works well in a jigsaw format. This also helps to keep the whole activity to an hour. There are six GPS stations so you can break the group or class into six teams. Each team analyzes data from one of the GPS stations.
Give each team:
- Photograph and GPS time series from one of the six stations - Volcanic Monitoring with GPS Pictures - Data Handout PDF (Acrobat (PDF) 22.1MB May30 20)
- Volcanic Monitoring with GPS Student Exercise PDF (Acrobat (PDF) 1.5MB May30 20)
- Westdahl Volcano Map of GPS Stations for Graphing (Acrobat (PDF) 891kB May26 18)
Have the students start by look at the data on their own or in pairs. Meanwhile if possible, project the Westdahl Volcano Map of GPS Stations for Graphing (Acrobat (PDF) 891kB May26 18) on a white board or with a document camera. Then have all the students working on the same station consult with each other. As each team reaches a consensus on their findings, they can come up and draw their vectors on the class-wide data vector map. Then the entire class can use the results to answer the Final Questions to interpret the results. These questions (listed on both the pptx and the student exercise) can be done verbally in a group discussion or as part of individual student write-ups.
With younger students (5th-6th grade), a compass rose can be used to help students visualize the correlation between GPS movement in a time series and the direction of a vector on a graph. Using a see-through paper on top of the print out of the compass.docx (Microsoft Word 2007 (.docx) 44kB Jun14 18) , have students trace the East-West and North-South axis to create a graph. By placing their gum drop GPS model at the intersection (O), students can move them in their "graph" using overall direction as shown in a time series (N/E, SW, etc..). This "compass graph" can then be replaced by a X/Y graph with its positive and negative value while still being correlated to Cardinal directions.
Alternatively, especially for older students, each learner could analyze the data from all six GPS stations and do a write-up. In that case the instructor would probably choose to ask somewhat more sophisticated data interpretation questions.
Answer Keys & Exercise Word Versions
- Volcanic Monitoring with GPS Pictures - Data Handout (Microsoft Word 2007 (.docx) 13.7MB May30 20)
- Volcanic Monitoring with GPS Student Exercise (Microsoft Word 2007 (.docx) 5.3MB May30 20)
Teaching Notes and Tips
- The GPS data can have some confusing additional noise. This can be a good opportunity to discuss the realities of scientific data which is rarely clean and perfectly easy to understand.
- Periods of no-date can be due to equipment failure. It can take extra time to get to a station and fix it in remote Alaska.
- A very noisy seasonal signal is often due to snow in Alaska (AV27 and AV29 particularly have this problem--possibly they are on the down-wind side of the mountain and thus snow drifts in there more).
- The provided data set goes from mid 2008 to mid 2018. The 10-year duration is particularly easy for quick calculations. However, if instructors which to access more recent data, these are the instructions. Access Data from Your Closest GPS station (Acrobat (PDF) 2.1MB Oct28 22)
- Although all the exercise handouts are provided in color for better on-screen viewing, the student work can all be successfully done on black-white print outs.
- Extension option:
- The exercise as written does not include analysis of the vertical signal. You could ask the students to calculate this change too and ask whether it seems to support the same conclusions. (Note: all the stations are moving up, which definitely supports the overall idea of inflation - in fact this can be assessed visually quite rapidly without having to do careful measurements)
Assessment
Formative assessment of student understanding can be gathered from classroom observation and discussions with individuals or small groups.
The student exercise serves as the summative assessment for the activity. Some questions have clearly correct answers. A simple rubric is provided at the end of the student exercise for the open-ended questions.
References and Resources
- Original IRIS webpages for the animations related to volcanic monitoring methods
- Alaska Volcano Observatory - Volcanoes in Alaska, monitoring information, pictures, and more
- USGS Volcanoes Hazards Program - Volcanoes in USA, monitoring information, pictures, and more
- UNAVCO GPS Velocity Viewer allows viewers to explore GPS motions around the world, including in Alaska.
- Access Data from Your Closest GPS station (Acrobat (PDF) 2.1MB Oct28 22) - 1-page document that walks through how to access GPS data from the Plate Boundary Observatory GPS Network.
- GPS Velocity Viewer allows viewers to explore GPS motions around the world, including in Alaska.
- Tectonics Motions of Alaska poster by UNAVCO
- How Does GPS Work?
- The activity was presented as part of the EarthScope ANGLE Educator Workshops. The associated presentation is Alaskan Volcanoes & Hazards Presentation.
- Contact ANGLE with questions or comments.