- Click this Google Earth download page link to open the download page in a new window.
- On the download page, click "Agree and Download" and the software will be transferred to your computer.

- Click "Run" twice, if you see more dialog boxes.
Launch Google Earth by double-clicking its icon or choosing it from the Programs list under the Start menu.
In Google Earth's menu panel on the left, under the Layers list, check the box in front of Borders and Labels to turn this layer on. At the bottom of the Layers list, click the More check box and select the Water Body Outlines.

![[creative commons]](/images/creativecommons_16.png)
Provenance: Betsy Youngman, none
Reuse: This item is offered under a Creative Commons Attribution-NonCommercial-ShareAlike license http://creativecommons.org/licenses/by-nc-sa/3.0/ You may reuse this item for non-commercial purposes as long as you provide attribution and offer any derivative works under a similar license.
This window is the same on both the Mac and Windows Operating systems.

Provenance: Betsy Youngman, none
Reuse: This item is offered under a Creative Commons Attribution-NonCommercial-ShareAlike license http://creativecommons.org/licenses/by-nc-sa/3.0/ You may reuse this item for non-commercial purposes as long as you provide attribution and offer any derivative works under a similar license.
Explore the global topography
- If necessary, launch Google Earth by double-clicking its icon on the desktop or dock.
- Choose File > Open and navigate to the Climate and Biomes3.kmz file.
The project will open showing a map of the world. If this is your first time working with Google Earth, take time to practice turning layers on and off and using the navigation tools (Zoom and Move map) to move around the globe. The Google Earth Users guide contains helpful instructions to get you started. The image below shows the flags indicating placemarks for the selected cities you will explore in this lab.

Provenance: Betsy Youngman, none
Reuse: This item is offered under a Creative Commons Attribution-NonCommercial-ShareAlike license http://creativecommons.org/licenses/by-nc-sa/3.0/ You may reuse this item for non-commercial purposes as long as you provide attribution and offer any derivative works under a similar license.
Explore temperature and geography
Turn on the Average Temperature (Day) for January layer. This layer shows the average daytime temperature for the years 1970-2000. It may take a few seconds to load. Take time to study the patterns of warm and cold areas on the globe. Use the legend on the upper-left corner of the map to help you interpret the colors. When you are done exploring this layer, turn it off, and turn on the Average Temperature (Day) for July. Observe the differences in these two layers. When you are done investigating, turn off both of the Temperature layers.
January temperatures.

Provenance: Betsy Youngman, none
Reuse: This item is offered under a Creative Commons Attribution-NonCommercial-ShareAlike license http://creativecommons.org/licenses/by-nc-sa/3.0/ You may reuse this item for non-commercial purposes as long as you provide attribution and offer any derivative works under a similar license.
July temperatures

Provenance: Betsy Youngman, none
Reuse: This item is offered under a Creative Commons Attribution-NonCommercial-ShareAlike license http://creativecommons.org/licenses/by-nc-sa/3.0/ You may reuse this item for non-commercial purposes as long as you provide attribution and offer any derivative works under a similar license.
Explore biomes and geography
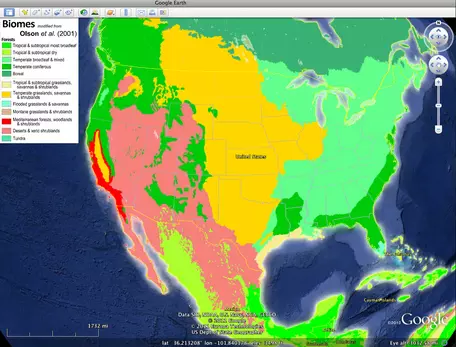
- Turn on the Terrestrial Biomes (Olson et al. 2001) layer. Explore the locations of biomes around the globe. You may need to turn the Legend on and off for better viewing.
Check the check box next to a name in the
Layers panel to turn the layer on. Click on the layer name to select it, and make it the active layer. In the image below the Biomes layer is active.

Provenance: Betsy Youngman, none
Reuse: This item is offered under a Creative Commons Attribution-NonCommercial-ShareAlike license http://creativecommons.org/licenses/by-nc-sa/3.0/ You may reuse this item for non-commercial purposes as long as you provide attribution and offer any derivative works under a similar license.
- With the Terrestrial Biomes layer selected (active), use the slider underneath the Places panel to make the layer more or less transparent. Use the Zoom and Move map tools to explore the relationship between biome types, elevation, and proximity to water bodies. Note the patterns that emerge between biome type and geography. Record the patterns you observe in your science notebook.
Patterns you might look for include proximity to water bodies, or over mountainous areas. Think of the regional climate drivers that you investigated in Lab 3B.
- Choose View > Grid to turn on the lines of latitude and longitude. Recall the Hadley Cells Hadley Cells: a direct, thermally driven and symmetric (north and south of the equator) circulation pattern that is influenced by Earth's rotation. and patterns of precipitation that you observed in Lab 3. With this in mind, notice the areas where deserts are located and areas where it is especially rainy. What geographical lines do these rainy regions fall between?
- When you are done exploring, turn the globe to re-center the view on North America.
Stop and Think
1. How do the biomes change as you go from west to east across the United States? Use your knowledge of regional climate forces to explain this pattern.
Explore climate and geography
- Turn on the Climate around the World layer. You will see a number of white flags appear on the globe. Click on the flags to see images of the climate zones as well as links to climographs of the cities.

Provenance: Betsy Youngman, none
Reuse: This item is offered under a Creative Commons Attribution-NonCommercial-ShareAlike license http://creativecommons.org/licenses/by-nc-sa/3.0/ You may reuse this item for non-commercial purposes as long as you provide attribution and offer any derivative works under a similar license.
- In the window that opens click the climograph link to open a climograph in a new browser window.

Provenance: Betsy Youngman, none
Reuse: This item is offered under a Creative Commons Attribution-NonCommercial-ShareAlike license http://creativecommons.org/licenses/by-nc-sa/3.0/ You may reuse this item for non-commercial purposes as long as you provide attribution and offer any derivative works under a similar license.
- Choose three or more cities that are at similar latitudes across the country and compare their climate and biome type. For example choose: San Diego, CA; Phoenix, AZ; Lubbock, TX; Jackson, MS; and Charleston, SC to compare.
- Then, choose two cities that share a line of longitude, and compare their climographs. How does geographic variation affect climate patterns?
The climographs used in this exercise are linked to the page
What is Climatology?, which also has some interesting resources about drought.
- Close the tabs or windows when you are done exploring.
Stop and Think
2. Look for two cities around the world that share a biome type and compare their climographs. Do they have similar temperatures and receive similar patterns of precipitation?
3. Describe the animals and vegetation that you see in the images of the climate zones.
4. How does climate and life vary around Earth's surface? Give specific examples from this Google Earth project.
5. Imagine you are a modern-day explorer and have been charged with describing how climate and biomes change as you travel north to south across a continent along one line of longitude. Write several paragraphs describing your imaginary journey by bus, train, car, or even horseback, from the North Pole to the equator. Tell your readers how the vegetation and animal life change as you travel south. Are the transitions gradual or abrupt? Use words to create a set of visual images for your readers. Be sure to include which line of longitude you are traveling on your journey. Optional: add sketches of the plants and animals that you saw on your journey.
Optional Extensions
Add the built-in weather layer to your project and explore today's weather patterns
In Google Earth, select the Weather layer and all the sub-layers including the clouds, radar, and information layer. In the information layer you can choose a 6- or 24-hour animation of clouds. Note: this is bandwidth intensive and may be best done on a home computer.
Investigate additional layers
If you have more time, you may want to add more layers to your map and explore other relationships. Some layers that could be included in the project are: Net Radiation January and July; Total Rainfall January and July; and NDVI vegetation January and July. This additional data can be downloaded from NASA Earth Observations (NEO). In NEO, be sure to choose the Google Earth image type in the Downloads Options box. Once you have downloaded the KML file, choose File > Open to add it to your globe.
Add a more detailed Climate Classification map
Students who are interested in acquiring more detailed maps of climate classifications may wish to visit this site: World Map of Climate Classifications. Files are available in PDF, GIS, and Google Earth format.
Investigate Temperature change over time
Download and add the World Temperature Observations 1901-1990.kmz (KMZ File 566kB Aug25 11) layer to your Google Earth project. Turn the layer on by clicking the radio button next to its name. Use the toggle arrow to open the folder for this layer. In the folder, you will see temperature observations for three 30-year intervals: 1901-1930, 1931-1960, and 1961-1990. Turn each one on successively and observe how the temperatures have changed during this time period. The change is especially noticeable around the poles. Turn off the Temperature Observations 1901-1990 layer when you are done exploring.
Make your own climograph
Download monthly average temperatures and precipitation totals for a city or region of your own interest from World Climate. The data is available in both English and metric units. Import the data into a spreadsheet program and create a climograph. Use the climograph that you create to compare climates around the world, or add it to the Google Earth project.
View a Climate and Biomes PowerPoint file
Click the thumbnail below to view a PowerPoint file of images and climographs.
 Click to view
Click to view