
Unit 1: Energy, Space, and Earth's Effective Temperature
Bob MacKay (Clark College)
Philip Resor (Wesleyan University)
Summary
This unit is designed to engage students by introducing them to patterns in recent climate and investigating possible reasons for recent changes. Students work in small groups to plot and analyze real-world temperature data covering a decade, and use that information to make predictions about future climatic trends. Whole-class discussions illustrate the differences between short- and long-term trends. Students also analyze graphs of solar irradiance to begin to determine reasons for the observed increase in temperature, setting the stage for Unit 2, which examines the role of the atmosphere in controlling Earth's surface temperature.
Learning Goals

![[reuse info]](/images/information_16.png)
By the end of the unit, students will be able to:
- Analyze temperature data, determine the temperature trend over the past century, and predict future temperature.
- Describe how choice of averaging period affects conclusions drawn from data.
- Calculate running mean from solar irradiance data.
- Compare a record of solar irradiance to the recent temperature trend and describe any observed relationship.
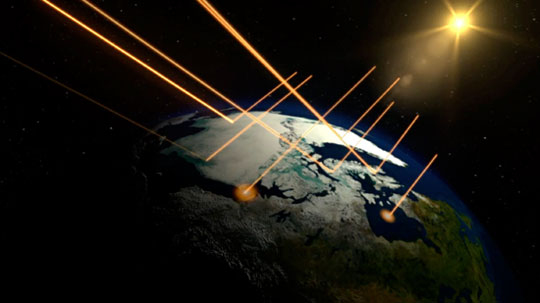
- Describe how energy moves through space and is received by Earth, and calculate Earth's effective temperature.
- Describe how the temperature trend may have affected natural and human systems.
Context for Use
Unit 1 is the entry point into the module on Earth's energy balance and the atmosphere. The first activity focuses on Earth's recent temperature record and as such, provides a compelling motivation for the rest of the module materials. It may be helpful to have students read this article (from Wired magazine) describing how temperature data are collected: How We Know 2014 Was the Hottest Year, by Marcus Woo.
This unit is divided into two sub-units, lasting approximately 25 minutes each, allowing instructors to use part or all of this unit. For instructors teaching during a 75-minute class period, there are ample opportunities for discussion, or the instructor may choose to move straight to the first half of Unit 2.
In each of the sub-units, there is an associated in-class activity to be performed in small groups, followed by a whole-class discussion. This should work for both large and small classes, though some grouping of responses may be necessary in larger class sizes. There are follow-up homework questions that build on the course material and that have students think about the implication of their findings for other elements of the Earth system and the human population, and develop a launching off point for discussing Earth's effective temperature in Unit 2.
Description and Teaching Materials
In class, students will work in small groups to analyze two different datasets:
- The surface temperature record since 1880: Temperature Anomaly (PDF) (Acrobat (PDF) 17kB Sep22 16)
- Solar irradiance data since 1880: Solar Irradiance (Acrobat (PDF) 31kB Feb16 15)
Instructors who are using multiple materials from this module may wish to give an initial survey examining students' knowledge of factors contributing to Earth's surface temperature. This is then followed up with an identical survey, administered at the end of the module, to evaluate students' learning. This is an ungraded survey. Ideally, it would be administered in the class previous to the start of the module.
- Word version: Concept Sketch Pre and Post Survey (Word) (Microsoft Word 2007 (.docx) 23kB Nov18 16)
- PDF version: Concept Sketch Pre and Post Survey (PDF) (Acrobat (PDF) 42kB Nov18 16)
In class, you will need:
- Chalkboard or whiteboard for collecting class responses
- Copies of handouts for Part 1 (Unit 1, Part 1: Analyzing Temperature Data (Word) (Microsoft Word 2007 (.docx) 35kB Sep13 16) or PDF (Acrobat (PDF) 370kB Sep13 16)) and Homework (Unit 1 Homework (Word) (Microsoft Word 2007 (.docx) 84kB Aug29 16) or PDF (Acrobat (PDF) 404kB Aug29 16))
- Ruler or other straightedge for drawing a best-fit line (Part 1)
- PowerPoint to guide the activity and discussion Unit 1 Powerpoint (PowerPoint 2007 (.pptx) 11MB Nov4 16)
Prior to class (5-10 minutes total)
5-10 minutes: (Optional) Administration of pre-module survey building a concept sketch of Earth's climate system. This survey can be administered at the end of the module to assess students' learning. Concept Sketch Pre and Post Survey (Word) (Microsoft Word 2007 (.docx) 23kB Nov18 16) or PDF (Acrobat (PDF) 42kB Nov18 16).
Part 1: The Global Temperature Record (25 minutestotal )
5 minutes: Introduction and setup. Make sure students know the concept of "anomaly" as it refers to temperature. Explain what a best fit line is in the context of this activity. Break students into groups of ~4 students each.
10 minutes: Activity: analyzing temperature data (Unit 1, Part 1; Unit 1, Part 1: Analyzing Temperature Data (Word) (Microsoft Word 2007 (.docx) 35kB Sep13 16) or PDF (Acrobat (PDF) 370kB Sep13 16)) . Each group is assigned a decadal subset of data (make sure 1900-1910, 1950-1960, and 2000-2010 are assigned) and analyzes it following the instructions from Unit 1, Part 1: Analyzing Temperature Data (Word) (Microsoft Word 2007 (.docx) 35kB Sep13 16) (PDF (Acrobat (PDF) 370kB Sep13 16)). During this time, the instructor will walk the room, checking groups' progress. In particular, students may need help with drawing the best-fit line and using it to determine a decadal temperature trend. Instructors may wish to make a table on the board of each decade used and have each group write their 2025 prediction on this table. This section may be ended early if groups have wrapped up, leaving more time for discussion.
10 minutes: Guided discussion using figures from PowerPoint:
- Solicit the class: What should the anomaly be in 2025? Could have students vote according to bins (e.g., -0.5-0, 0-0.5, 0.5-1, 1.0-1.5). The answers should vary greatly, so suggest looking at 3 different time periods.
- First three figures on power point plot out 1900-1910, 1950-1960, and 2000-2010. Ask the groups working on those decades what they found, then look at the graph for the corresponding decade.
- After looking at these 3 time periods ask the class: what is going on here? Why are we seeing different patterns with different time periods?
- Then, show the fourth figure, which shows the full dataset from 1880-2015. Temperature Anomaly (PDF) (Acrobat (PDF) 17kB Sep22 16)
- What does the overall pattern look like?
- Consider the overall pattern compared to the section your group observed; what differences do you see?
- What factors do you think contribute to earth's temperature? Segue into Part 2...
Part 2: Introduction to the Whole Module, Solar Irradiance, and Earth's Temperature (25 minutes total)
5 minutes: Introductory module slides (immediately after full temperature record)
10 minutes: Introduction to the electromagnetic spectrum, blackbody radiation, and the concept of solar irradiance; examination of blackbody spectra of 3 objects (the Sun, a light bulb, the Earth). For the spectral analysis, the instructor can divide the class into 3 sections and have each section determine peak intensity and wavelength for an object.
5 minutes: Examination of the graph of solar irradiance, discuss findings with adjacent classmates before whole-class discussion.
5 minutes: Discussion: what patterns are visible in the solar data? Do you see a connection between solar irradiance and the long-term temperature pattern?
End of class: distribute Homework (Unit 1 Homework (Word) (Microsoft Word 2007 (.docx) 84kB Aug29 16) or PDF (Acrobat (PDF) 404kB Aug29 16)) if using.
Teaching Notes and Tips
Part 1 of this unit incorporates group work to analyze datasets. While this can be successful in both large and small classes, it is often helpful to prepare the groups ahead of time for larger classes. The instructor may wish to give students their group assignments during the prior class, so that groups can be seated together at the beginning of class. This will minimize time spent shuffling around and finding group members. In smaller classes that may not include all decades, instructors should make sure the decades of 1900-1910, 1960-1970, and 2000-2010 are included (as they are part of the discussion).
In Part 1, students are asked to draw a best-fit line representing the trend in their decade of data. Depending on the background of students in the class, instructors may find it helpful to sketch out an example on the board. The instructor may also wish to take a few moments to plot out a couple of example anomalies. Students occasionally have problems plotting the decimal correctly (e.g. they will plot 0.8 degrees instead of 0.08 degrees and therefore show a much larger anomaly).
In Part 1, there are multiple points in the PowerPoint that pose a question to the class. Many of the questions are answered or explored more in the following slides, or within the same slide as an animation. Questions that will have followup explanation are indicated with italics, to remind instructors not to advance until the class has responded.
In Part 2, students look at radiation spectra from the Sun, a light bulb, and the Earth using pre-generated figures. If the technology is available in class, students and/or the instructor could alternatively generate the spectra themselves through the tool at https://phet.colorado.edu/sims/blackbody-spectrum/blackbody-spectrum_en.html.
Instructors may wish to collect the group work from Parts 1 at the end of class and distribute the homework questions at this time to make it clear which work remains to be done.
If the instructor is adapting this for use in a 75-minute class, the calculation of Earth's effective temperature (currently a take-home question introduced in the last PowerPoint slide) can be done as a think-pair-share activity, where the students calculate and compare their results, and discuss whether or not they make sense. This should lead well into Part 1 of Unit 2, where students investigate Earth's incoming and outgoing radiation spectra to understand why Earth's effective temperature is so much lower than its actual temperature.
Instructors may consider having students read the following article from Wired, which explains how temperature data are collected: How We Know 2014 Was the Hottest Year, by Marcus Woo.
Assessment
- Unit 1, Part 1 in-class activity and following whole-class discussion assess learning goals 1 and 2
- Think-pair-share activities and whole-class discussion following solar irradiance activity assess learning goals 3 and 4
- Homework assignment assesses learning goals 2, 5, and 6
- Assessment Answers (Word) (Microsoft Word 2007 (.docx) 14kB Aug4 16) / PDF (Acrobat (PDF) 387kB Aug4 16)
Exam questions tied to the unit's learning goals can be found here:
- Exam questions (Word) (Microsoft Word 2007 (.docx) 44kB Aug4 16) / PDF (Acrobat (PDF) 353kB Aug4 16)
Instructors may use the pre/post survey in class or as a take-home assessment tool.
- Concept Sketch Pre and Post Survey (Word) (Microsoft Word 2007 (.docx) 23kB Nov18 16) / PDF (Acrobat (PDF) 42kB Nov18 16)
References and Resources
- NASA, NOAA Find 2014 Warmest Year in Modern Record: http://www.nasa.gov/press/2015/january/nasa-determines-2014-warmest-year-in-modern-record/#.VOIFFSxc8Xg
- NASA video describing electromagnetic radiation from the Sun and Earth http://www.youtube.com/watch?v=nNzDXXUiqRs
