Guiding Students Through Interpreting Lines and Graphs
An Instructor's Guide to Reading Points from a Curve
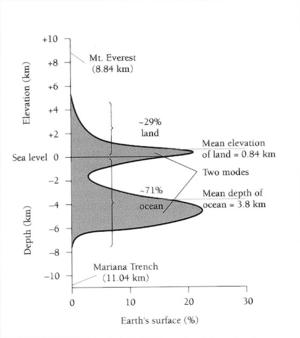
 Geologists use graphs in a variety of simple ways that nearly any student can comprehend. Graphs are visualizations of (often large) groups of data that can be used to predict geologic events, to characterize the behavior of systems, and to help geologists generalize about systems that might not be easy to understand just by looking at a bunch of numbers. Graphs are a way of making scores of data points manageable and, often, more understandable. Introductory geoscience course activities rely heavily on interpretation of graphical data, asking students to read from curves and lines that represent natural phenomena. However, few introductory textbooks describe the mathematics behind the graphical data and almost none provide support for students who are unfamiliar with interpreting graphical data. In addition, some graphs in the geosciences are types that are completely unfamiliar to students (e.g., Hjulstrom's diagram or the Hypsometric Curve), and many of the graphs are rotated sideways (like the one to the right) or turned on their heads (to mathematicians), violating some of the rules students may have learned in high school algebra. This guide is designed to help you to use the Reading points from a curve effectively in your introductory geoscience courses.
What Should the Student Get out of this Page?
By the time the students have worked through the module, they should be able to:
- identify questions that ask the student to collect/read data from a plotted line or curve
- differentiate between the x- and y-axes and indicate units on those axes
- distinguish which axis is the known variable and which axis has the variable that is to be determined
- use the procedure outlined on the reading points from a plot page to determine the value of an unknown variable
Why Is It Hard for Students?
When confronted with a plot with a line or a curve, many of our students just freeze up. There are myriad reasons for this type of behavior. In general, we are asking students to extrapolate or interpolate numbers from a line (without points plotted on the line). This is a task that students may not know how to do—graphs are often taught as a place to put data, not a place to gather data. Here are some reasons that students might struggle with this concept:- In math classes, students go from functions to data to graphs; we ask them to go from a graph to pulling data off the graph.
- Some students are just overwhelmed by the numbers and the axes and trying to remember what they need to do.
- Many do not know where to begin on any mathematical task. The graph may be nothing like any graph they have ever seen before (many graphs in introductory geoscience textbooks put all kinds of extra information on graphs, things that are visual but not mathematical, and this can confuse students who are already frightened by math.
- The task of collecting data without the points illustrated on the line (e.g., interpolating between points) may be one that some students have never been asked to do (see this algebra tutorial on reading line graphs).
- In other cases, they may not have been asked in the way that their geoscience textbook asks them to proceed.
In any case, there are numerous reasons that students struggle with reading plots, and this module is designed to get them more comfortable with collecting data from plots and to provide them with support that is often absent from their textbooks.
What Have We Left Out of This Page?
This page is designed to help students with reading points from a single line or curve. We do not talk at all about some of the other graphs, such as field diagrams (e.g. Hjulstrom's and metamorphic facies diagrams) or cumulative percent graphs (e.g., the igneous rock classification diagram).Instructor Resources
- You may wish to visit the Basic Graphing Skills page in the Teaching Quanitative Literacy portion of SERC's website.
- Jim Reed has some resources on graphing relations that guide students through interpolating and extrapolating data.
- The Hypsometric Curve module within The Math You Need, When You Need It is basically a graph reading/interpretation module designed to help students with a very specific graph that often confuses them.
- Interactivate has a set of lessons around reading graphs.


