
Part 1—Download and Install Software and Data
Step 1 – Download and Launch GeoMapApp Software
- Open the GeoMapApp home page in a new window.
- From the Download Links panel on the left of the page, click the link for your computer's operating system.
- On the new Web page that comes up for your computer, scroll to the bottom of the page, read the terms of distribution, and click AGREE to download the software.
- When the download is complete, locate the program file on your computer (wherever your downloads are stored) and double-click the GeoMapApp icon to start the program.
- When GeoMapApp launches, three maps are displayed. Click Agree to select the default Base Map in South Polar projection. (The center map).

![[creative commons]](/images/creativecommons_16.png)
- Once GeoMapApp is running, the base map is displayed.
- If you prefer, you can launch GeoMapApp directly from the Internet using Java Web Start. To do this, use the "here" link on the GeoMapApp home page instead of the Download Links. Click on the question mark if you need help using Java Web Start.
- Take a few minutes to explore the built-in tools and the base map.


Step 2 – Review a Short Video on recent Antarctic Research
- Watch the short (2:46 minute) video of Dr. John Anderson, below, then answer the following questions in your journal.
- How are sediment cores different from ice cores?
- What clues were initially found in the sediment that allowed identification of a warm period?
- Why is Antarctic research important to help us understand today's climate?
- You may also want to read a short summary of Dr. Anderson's paper: Progressive Cenozoic cooling and the demise of Antarctica's last refugium. Anderson, et al (2011)
Step 3 – Review Data from the Core
Now that you have learned a little about John Anderson and his work, you will review the following table of data from the expedition and then answer some introductory questions, located below the table.

The data shown in the table, above, were collected during a research cruise to the Antarctic Peninsula. Fossil pollen recovered from core samples obtained by the scientists was identified and correlated to sediment age. According to the table:
- Which core sample is the oldest?
Use the geologic timescale shown below, along with the age constraints shown in the table, above, to identify the epoch name and time period for each core sample. Click on the image for a larger view.
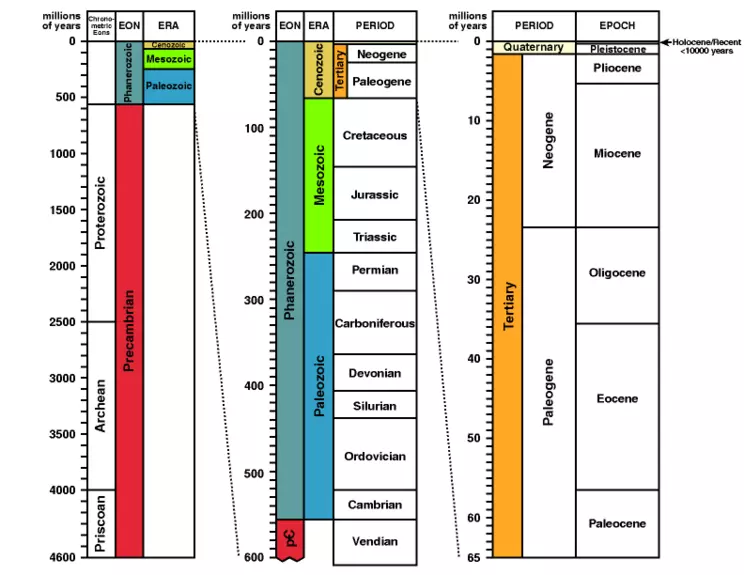 Geologic Time Scale.
 Image source: University of Calgary
- What are the periods and epochs of the core samples?
Now that you have a sense of the age of the core samples, compare the Nothofagidites fusca abundance with the conifer group abundance in the SHADRIL table, above.
- What pattern do you notice in the abundance data?
- What are the main classification differences between these two plant groups?
- Which is a conifer?
- Which is deciduous?
Step 4 – Download the Core Data
In Part 2, you will upload the core data that you just analyzed into GeoMapApp. By mapping the data you will be able to make additional observations about the spatial patterns that exist in the core data.- Download and save the SHADRIL core data to use in Part 2. To download the file, right-click (PC) or control-click (Mac) on the link to the file, below.
- Save the file on your desktop or in the documents folder so that you can easily locate it for use in Part 2. Pollen Averages Spreadsheet file (Excel 17kB Apr19 13)


