
Teaching Notes
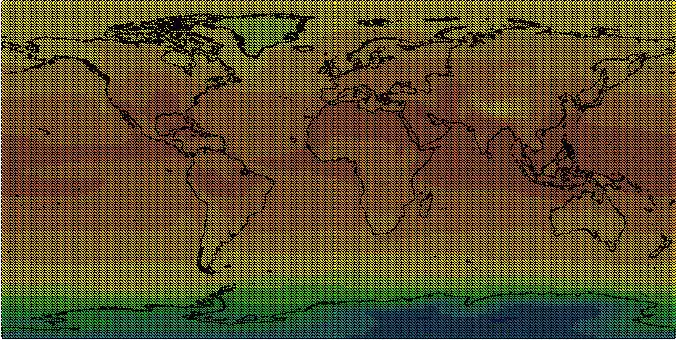
Example Output
Grade Level
This chapter can be used as a professional development activity or can be assigned directly to students. It is most appropriate for students in grades 10 to 12 or in upper level high school or undergraduate courses.
Learning Goals
After completing this chapter, students will be able to:
- download, combine, and analyze data sets from NCAR's GIS Climate Change Portal;
- work with models that are used as predictors of possible future conditions;
- visualize one of the components of climate change, that of variations in mean air temperature;
- make predictions based on the analysis of single variables for future conditions; and
- describe how temperature anomalies can affect human health.
Background Information
This chapter only deals with the air temperature anomaly portion of the tutorial. The user is invited to review the complete tutorial for the additional statistical (standard deviation and t-test) analysis.
This chapter demonstrates how to analyze climate projections from a Global Climate Model (GCM) in a Geographic Information System (GIS) using climate datasets generated by the Community Climate System Model (CCSM) for the Intergovernmental Panel on Climate Change (IPCC) 4th Assessment Report (more info) . The data is distributed through the NCAR GIS Initiative Climate Change Scenarios portal in a GIS format. Many atmospheric and land variables are available from the CCSM and the GIS Climate Change portal.
- Variable: Air Temperature (tas)
- Region: Global
- Analysis: Summer months' temperature anomaly in 2030 with respect to the average summer temperatures of present-day climate.
- CCSM model runs:
- 20th Century Experiment; Ensemble Average; months June, July, August; years 1980-1999
- Scenario A2; Ensemble Average; months June, July, August; years 2021-2040
Listed below are four additional sources of information on climate change.
- Weather and Climate Basics—background information from UCAR
- About Climate Research—NCAR
- Earth Lab: Degrees of Change—Interactive from Koshland Science Museum
- Short webcasts about climate change—NCAR Scientists Discuss Global Warming and its Impacts
Key Terms and Prerequisite Knowledge
Students who use this chapter will need to be familiar with the following key terms. It is important to stress the difference between Global Warming and Climate Change, as these terms have incorrectly been used interchangeably in most popular media.
- Anomaly: A deviation from the common rule; an extreme.
- Climate Change: A long-term change in the Earth's climate or of a region on Earth.
- Climate Model: Climate models are a mathematical representation of the earth's climate system and climate modelers employ a technique called ensembling to capture the range of possible climate states.
- Climate forcing: A variable that impacts climate, usually the focus of the climate experiment. It sets into motion the change.
- Ensemble: A climate model run ensemble consists of two or more climate model runs made with the exact same climate model, using the exact same boundary forcings, where the only difference between the runs is the initial conditions.
- Global Warming: the increase in Earth's average surface temperature due to rising levels of greenhouse gases.
Instructional Strategies
This chapter is intended for advanced students of climate change. It can be used as a lab activity or homework assignment. In order for users to grasp the concepts described in the chapter, background reading and discussions should precede the GIS analysis.
Conveying the relationship between increases in mean summer temperatures and the probability of extreme events, such as heat waves, is central to this analysis. Two resources along these lines include the following.
- Change in Mean Temperature as a Predictor of Extreme Temperature Change in the Asia-Pacific Region, (Acrobat (PDF) 3.7MB Jan31 09) Griffith et al 2005
- Extreme climatic events and their evolution under changing climatic conditions (Acrobat (PDF) 637kB Jan31 09) Martin Beniston and David B. Stephenson 2004
It is important for users to understand that scientific studies demonstrate that even small changes in the mean state of climate can result in the large change in the probability of extreme events (Griffith et al 2005) (Acrobat (PDF) 637kB Jan31 09). By analyzing the anomaly of mean summer temperatures, offered in this chapter, users can identify potential regions at risk to increased probability of extreme heat events.
The Frequently Asked Questions (FAQs) of the IPCC deal with this question of climate change and extreme events as well.
In a warmer future climate, there will be an increased risk of more intense, more frequent, and longer-lasting heat waves. The European heat wave of 2003 is an example of the type of extreme heat event lasting from several days to over a week that is likely to become more common in a warmer future climate.
Software Requirements
This chapter uses ESRI's ArcGIS 9.3 software which requires a Windows operating system. ArcGIS 9.3 System Requirements. It is possible to run ArcGIS on a Apple Intel-based computer using emulation software such as Parallels or VMware Fusion.
If your school or institution doesn't already have ArcGIS 9.x installed in your classroom or computer lab, you can request an evaluation DVD from ESRI by filling out the form at Request Evaluation DVD.
Note: It can take from 10-14 business days to receive the evaluation DVD after submitting your request so be sure to plan accordingly.
Learning Contexts
Science Standards
The following National Science Education Standards are supported by this chapter:
Grades 9-12
- Formulate and revise scientific explanations and models using logic and evidence.
- Use technology and mathematics to improve investigations and communications.
- Scientists rely on technology to enhance the gathering and manipulation of data.
Geography Standards
The following U.S. National Geography Standards are supported by this chapter:
- How to use maps and other geographic representations, tools, and technologies to acquire, process, and report information from a spatial perspective
- How to analyze the spatial organization of people, places, and environments on earth's surface
- The physical processes that shape the patterns of earth's surface
- How human actions modify the physical environment
Other Standards
- Technology productivity tools. Students use technology tools to enhance learning,increase productivity, and promote creativity.
- Technology problem-solving and decision-making tools. Students use technology resources for solving problems and making informed decisions.
Time Required
Optional Downloads
The following shapefiles and/or project files contain all the data layers needed for this chapter.Part 1. Step 5. Folder of zipped data flies from CCSM Data Portal (Zip Archive 23.5MB Feb3 09)
The most time-consuming steps in this chapter are the calculation of the Summer Air Temperature Averages for both 1980-1999 and 2021-2040 in Part 2. Below are the completed shapefiles for the steps. These can be downloaded and provided to students. Students will still need to calculate the 20-year Average for both these time periods in Steps 3 and 5.
Part 2. Summer Air Temperature Averages
Step 2. Calculate Summer Averages for 1980-1999
tas_JJA_1980_1999_20th_Century_Experiment_completed (Zip Archive 8.1MB Jan10 09)
Part 2. Summer Air Temperature Averages
Step 4. Calculate Summer Averages for 2021-2040
tas_JJA_2021_2040_Scenario_A2_completed (Zip Archive 8.1MB Jan10 09)
Completed project files with data
Part 2. Folder containing completed project file with data at the end of Part 2. NCAR Climate Change Part 2 complete (Zip Archive 21.2MB Feb3 09)
Part 3. Folder containing completed project file with data at the end of Part 3. NCAR Climate Change Part 3 complete (Zip Archive 27.4MB Feb3 09)
Other Resources
- IPCC Homepage
- Climate Change 2007: Synthesis Report Summary for Policymakers (PDF file)
- Climate Change 2007: Synthesis Report (PDF file)
- United State Global Change Research Program has up to date reports on global climate change impacts as well as educator resources, including an image gallery.
- Increase in Urban Population
- NWS Heat Wave Information
