empty
Example Output
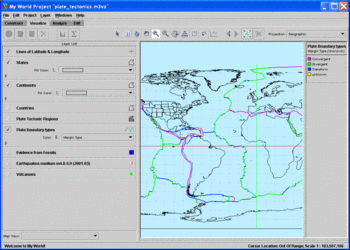
Sample of My World Project File in Visualize mode, showing plate boundaries by type, continental outlines and lines of latitude and longitude.
Grade Level
The activity is most appropriate for students in grades 7-10.
Learning Goals
After completing this chapter, students will be able to:
- create a project with My World GIS;
- add and manipulate layers;
- add data to a map view and make selections from the data; and
- analyze the data for evidence to support the theory of plate tectonics.
Rationale
My World GIS is a powerful tool that allows students to create projects that display different types of geographic information. As students add data to their maps, they visualize and analyze the distribution of data for trends, patterns, etc. By using the datasets offered in this chapter, students create a compelling argument for the theory of plate tectonics. The data and tools available in My World GIS can also be used throughout an Earth System Science or Geography curriculum, such as in units on geologic activity, hydrology, and climate.
Background Information
Prerequisite knowledge:
- Students should know how to read a map and how to locate latitude and longitude.
- Students should have a general understanding of the theory of plate tectonics.
- Students should know the different types of tectonic plate boundaries and the geologic activity associated with each type of plate boundary. Four types of plate boundaries are recognized by the U.S. Geological Survey (USGS): Divergent, Convergent, Transform, and Plate-boundary zones. Plate-boundary zones identify areas that are not well defined and the effects of plate interaction remain unclear.
- Students should know how fossils are created, and how the type of fossil organism found can provide clues to past environments.
This chapter provides a variety of datasets to be used in a My World GIS project to show the distribution of various strands of evidence that support the theory of plate tectonics. The Tool and Data section of this chapter discusses where the data comes from and how it is integrated into the My World GIS program.
Instructional Strategies
Students should work on this chapter where they have access to computers and by themselves or in teams of two. Using a teacher led-discussion, brainstorm the types of evidence that are available to support the theory of plate tectonics. While working with each layer of data in My World GIS, take the time to discuss the type and distribution of the evidence.
The content of this chapter may also be used in conjunction with the following instructional strategies for plate tectonics; other supplemental resources are listed at the bottom of the page.
'Evidence for Plate Tectonics Teaching Box' accessed at
http://www.teachingboxes.org/jsp/teachingboxes/plateTectonics//
Learning Contexts
The content of this chapter can be used at any point within a unit on plate tectonics. It would work well as an investigative introductory chapter, as an activity that supports the unit content, or as a culminating activity.
Science Standards
The following National Science Education Standards are supported by this chapter:
Grades 5-8
- 8ASI1.3 Use appropriate tools and techniques to gather, analyze, and interpret data.
- 8ASI1.4 Develop descriptions, explanations, predictions, and models using evidence.
- 8DESS2.1 The Earth processes we see today, including erosion, movement of lithospheric plates, and changes in atmospheric composition, are similar to those that occurred in the past. Earth history is also influenced by occasional catastrophes, such as the impact of an asteroid or comet.
- 8DESS2.2 Fossils provide important evidence of how life and environmental conditions have changed.
Grades 9-12
- 12ASI1.3 Use technology and mathematics to improve investigations and communications.
- 12ASI1.4 Formulate and revise scientific explanations and models using logic and evidence.
- 12DESS3.3 Interactions among the solid earth, the oceans, the atmosphere, and organisms have resulted in the ongoing evolution of the Earth system.
Geography Standards
The following U.S. National Geography Standards are supported by this chapter:
- How to use maps and other geographic representations, tools, and technologies to acquire, process, and report information from a spatial perspective
- How to apply geography to interpret the past
- How to apply geography to interpret the present and plan for the future
Time Required
Two 45-minute periods.
Other Resources
Background Information and Animations:
SERC visualization collection - Plate Tectonic Movement—a large collection of supplemental materials.
Plate Tectonics—animated images to show motion of plates.
This Dynamic Earth—a USGS background resource.
Completed My World Project file
The complete project file for this activity is located here: Evidence.m3vz ( 7.7MB May18 10). This file has all of the layers needed to complete the project as well as some additional optional layers for further exploration. Teachers may decide to use this file, rather than have students construct their own maps in Parts 3 and 4. Right-click on a PC, or control-click on a Mac, to download the file.


