Part 3—Explore GLOBE Surface Temperature Data
Step 1 – Explore GLOBE Surface Temperature Data in Table Format
Get a sense of the data collected by the GLOBE students by observing the data table for the Globe surface temperature layer.- Launch My World GIS by double-clicking its icon on your desktop or by clicking its icon in the dock (Mac) or Launch Bar (PC).
- Choose File > Open Project, and navigate to the file that you saved at the end of Part 2, Urban_Heat_Island_Part2.m3vz. Select the file and then click Open.
- Make the GLOBE data layer (ATM_4bf04b80_014396b8.shp) the Active Layer by single clicking on its name in the Layer List. Then click on the Show Table of Active Layer
 button to open the table of the GLOBE surface temperature data layer. A new table will open.
 - Scroll down the surface temperature column (SURFT) of the table to answer the following questions:
- How many records are there in this dataset?
- What is the maximum surface temperature?
- What is the minimum surface temperature?
Step 2 – Explore GLOBE Surface Temperature Data in Map View
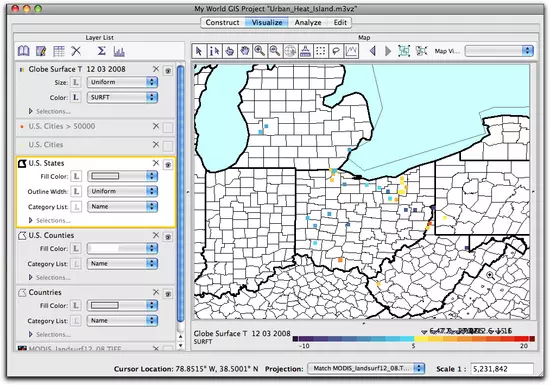
Now that you know something about the data in this layer, you will edit the appearance of the layer to show the surface temperature values.- Double click on the GLOBE data layer (ATM_4bf04b80_014396b8.shp) in the Layer List. (Remember that your layer may have a different number after the ATM). In the Edit Appearance window that opens, increase the size of the symbols to 50 %, color the data by surface temperature (SURFT), and choose the temperature color scheme. Limit the range of values to a Minimum of -10 degrees and a Maximum of 20 degrees. Change the name of the Layer to Globe surface T 12-03-2008.
- The GLOBE sites are now visible on the map. There is also a legend for the layer at the bottom of the map.

- Turn off the U.S. Cities layer to make it easier to see the GLOBE data.
- Use the Zoom In, Zoom Out, and Move Map Tools on the toolbar to center the map on the north central US where there is a large cluster of data points.
- Edit the appearance of the U.S. States layer. Increase the size of the outline width to make state boundaries more obvious.
- Zoom in and center the map view on the states of Ohio, Pennsylvania, West Virginia.
- Answer the following questions while observing the map.
- Now can you see the school sites?
- Can you determine which ones are reporting higher or lower temperatures?
- Click on Globe surface T 12-03-2008 in the Layer List. to make it the active layer. Then click on the Show Histogram/Bar Chart for the Active Layer
 button at the top of the Layer List. When the Histogram window opens, choose SURFT from the drop-down menu as the field for which to view the histogram.

- In the Statistics window at the bottom of the Histogram window, notice the Maximum, Minimum, and Mean (average) temperatures for the selected schools.
- Close the histogram window when you are done.
- Save the project file with a new name, such as Urban_Heat_Island_Part3.
- Quit My World GIS.

Step 3 – Explore GLOBE Surface Temperature Data Using a Histogram
If you have trouble importing the GLOBE surface temperature data, or need a fresh project file with all the data for the next part of the chapter, then use this project file. This file contains the GLOBE surface temperature data for December 3, 2008 and the other layers used in this part of the chapter.
Urban_Heat_Island_Part3.m3vz ( 3.4MB Jun2 10)
Right-click (PC) or control-click (Mac) the link above to download the file.
Urban_Heat_Island_Part3.m3vz ( 3.4MB Jun2 10)
Right-click (PC) or control-click (Mac) the link above to download the file.


