Estimating Okun's Law
This material is replicated on a number of sites
as part of the
SERC Pedagogic Service Project
Initial Publication Date: October 14, 2010
Summary
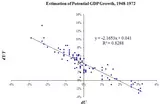
In this Excel spreadsheet exercise, students will estimate the growth rate version of Okun's Law and in doing so will estimate the Okun's Law parameter and potential GDP growth for three periods: 1949-1972, 1973-1996, and 1997-2009. Students learn how to make a scatter plot of data, plot a linear regression line and interpret the results. The results show the slowdown in GDP growth after 1972 and a relatively stable Okun's Law parameter of around 2. The regression estimation is automated and requires no knowledge of statistics.
Learning Goals
Understanding Okun's Law, potential GDP growth and unemployment rate. Practice plotting data, fitting a line (simple linear regression), and computing percentage changes. Interpreting intercept and slope coefficients.
Context for Use
This is appropriate for any undergraduate macroeconomics course: the Principles level, intermediate level or electives.
Description and Teaching Materials
Please see the attached documents for details:
- Detailed student instruction sheet with instructor notes at end (Microsoft Word 37kB Apr12 10)
- Excel file with formatted data and completed assignment (Excel 51kB Mar18 10)
Teaching Notes and Tips
I use the assignment in a laboratory class, taking about 30 minutes. This assignment works fairly smoothly. I give verbal instructions and a demonstration on how to do the assignment but the student instruction sheet provides a back-up. The assignment may be expanded to have students gather and manipulate the data themselves.
Assessment
Students may hand in the completed spreadsheet with correct interpretation. I also ask questions on exams to interpret a figure depicting results as they appear in the lab assignment.
References and Resources
The data can be found at the Federal Reserve Bank of St. Louis FRED database .

