Week 2: Analyzing Change Over Time
On this page
Using ImageJ to Analyze How Lake Mead Has Changed Over Time: Part 2
Investigation Questions:
- How has the surface area of Lake Mead changed over time?
- How has the water level in Lake Mead changed over time?
Download and Open the Images
- Launch ImageJ
 , choose File > Open, navigate to your Week 2 folder and open the Lake Mead stack that you saved in the previous section (with the scale set and scale bars added).
 - If you didn't save the stack, or you can't find it, right-click (Win) or control-click (Mac) to download a copy to your Week 2 folder, then open it.
Select a Region of Interest to Measure
In this investigation, the region of interest is the lake. To measure the area of the lake, you need to select or highlight it in some way. There are many ways to do this. In your own investigations, you may need to experiment with different techniques until you find the one that works best for you. Using the selection tools to outline the lake would be tedious and probably wildly inaccurate.
The key question is: What is it about the lake that makes it stand out from what isn't lake in the image? The color? The brightness? The water in these images appears much darker than the land. ImageJ has tools that can use these differences to highlight and select just the lake.
Specifically, you're going to use the Wand (tracing) tool ![]() to select the pixels that represent water. When you click on the image with this tool, ImageJ selects all of the pixels within a contiguous area - touching each other - that have values within a specified range, called the tolerance. For example, if the pixel you click on has a value of 25 and the tolerance is set to 20, all adjacent pixels with values from 5 to 45 would be selected. Using this tool takes a little practice, but you should get the hang of it quickly.
to select the pixels that represent water. When you click on the image with this tool, ImageJ selects all of the pixels within a contiguous area - touching each other - that have values within a specified range, called the tolerance. For example, if the pixel you click on has a value of 25 and the tolerance is set to 20, all adjacent pixels with values from 5 to 45 would be selected. Using this tool takes a little practice, but you should get the hang of it quickly.
- Flip to the first slice - the image of the lake in 2000.
- To set the tolerance, double-click the Wand (tracing) tool
 to open the Wand Tool window and set the Tolerance to 20. For now, leave the mode set to Legacy and click OK.
 - Using the Wand (tracing) tool
 , click anywhere on the lake. The selected pixels will be outlined in yellow. If your first click with the wand doesn't highlight all of the lake (and just the lake), hold down the shift key and click in each of the areas you want to add to your selection. If you select too much or the wrong area, choose Edit > Selection > Select None and start over.
Measure the Region of Interest
- Choose Analyze > Measure. The surface area of the lake, in square kilometers, will be reported in the Results window.
- Flip to the second slice of the stack showing Lake Mead 2004.
The yellow selection outline is still visible, showing the shoreline of the lake in 2000 superimposed on the 2004 image. This is another technique for making visual comparisons. You don't want to do it now, but you could draw this outline on the image to make it permanent.
- Choose Edit > Selection > Select None to remove the 2000 outline, then repeat the process using the Wand (tracing) tool
 to outline and measure the surface area of the lake in 2004.
You have measured the surface area of Lake Mead in 2000 and 2004. Write down your results or print out the ImageJ Results window. (Or, you could export it as spreadsheet data, but that seems overkill with just two areas.) To estimate the volume of the water lost over this four year period, you need to know the change in elevation of the lake surface that corresponds to this time interval.
Quantify the Change in Depth
Ground-based images often complement the views we get through our eyes in the sky. To determine the change in the elevation of the lake, we'll use good old-fashioned snapshots of Lake Mead.
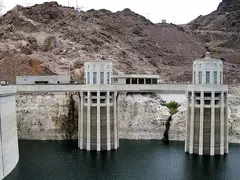
Hoover Dam was completed in 1936 and continues to be a popular and scenic tourist stop. Visible in almost every tourist snapshot of the dam and the lake behind it are one or more of four white concrete structures, connected to the dam by concrete walkways. These are the very tops of four huge water intake towers that feed lake water to the electric generators below the dam.
- Click the thumbnail at right to open a larger version of the image, right-click (Win) or control-click (Mac) on the large image, and save it to your Week 2 folder.
- Open the hoover_dam_intake_10_26_2004.jpg image in ImageJ.
This image shows the two intake towers on the Nevada side of the dam. You will use the information about these towers to set the scale for measuring the water elevation.
- Using the Straight line selection tool
 , measure the diameter across the top of either intake tower.
 - Choose Analyze > Set Scale... and enter the known diameter of 48 feet.
The same can't be said for photographs like this one. The features in the image are at different distances from the camera. When you set a scale on an image, it is only meaningful for features at one distance. Be sure to use the same intake tower for setting the scale and measuring the distance from the high water mark (the bottom of the walkway) to the lake surface.
- Using the Straight line selection tool
 , measure the distance from the bottom of the concrete walkway straight down to the water surface below that point.
 - Here are some questions to think about:
- Based on your measurements, what was the elevation of the lake surface in 2004? (Remember, the bottom of the walkway is at an elevation of 1226 feet above sea level.
- To complete this investigation, what kind of image would you need to estimate the total loss of water between 2000 and 2004?
- How could you employ ground-based photography or other "ground truthing" methods with your students? Now that you have these two measurements - the loss of surface area and the change in depth - what would you have your students do with them?
Try it Yourself
In case you want to practice this technique more, or want to continue the investigation, here is a set of intake tower images from different years, courtesy of the U.S. Bureau of Reclamation. Additional images are available online, but can't be distributed here due to copyright restrictions.
Here is a page of links to time series image data in NASA's Earth Observatory.
- Browse through these pages and find a set of images that interests you.
- Download the files to your Week 2 directory or folder and use ImageJ to open, stack, and flip back and forth between the images.
- Share your thoughts on the following questions with your discussion group:
- What observations and measurements could you make using these images?
- Where might time series images fit into your curriculum?
Resources
- Earth Observatory: World of Change: time series of images that demonstrate change over time.
Movies on This Page
How to download movies
- Click the link to go to the SERC media library listing for the movie. The record will open in a new window.
- On the SERC media library page, right-click (Win) or control-click (Mac) the link (below the movie on the Flash version pages) to download the movie file to your hard drive.
Flash video versions
Download this version to play on your computer. You'll need an appropriate movie player to view the file, such as Flash Player , Real Player (Mac / Win), or Adobe Media Player.
![]() Measure Lake Area
Measure Lake Area
![]() Measure Lake Elevation
Measure Lake Elevation
top of page
iPod versions
Download this version to play on your iPod or iPhone.


