
ConcepTest: Divergent Boundary
Question:
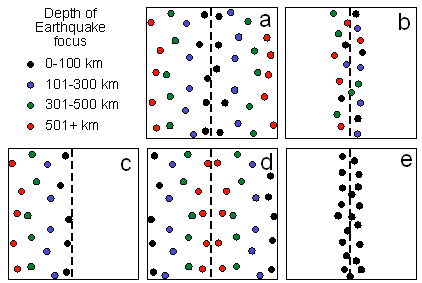
The figures below show the location of a plate boundary (dashed line) and the distribution of earthquake foci (filled circles). The color of the filled circle indicates the depth of the earthquake focus. Given the distribution of the foci, which figure best represents a divergent plate boundary?
a.b.
c.
d.
e.
Student Responses:
No data yet. The correct response is E.
If you would like to help acquire more Before and After statistics for this example, please contact the authors (see link at top of page).