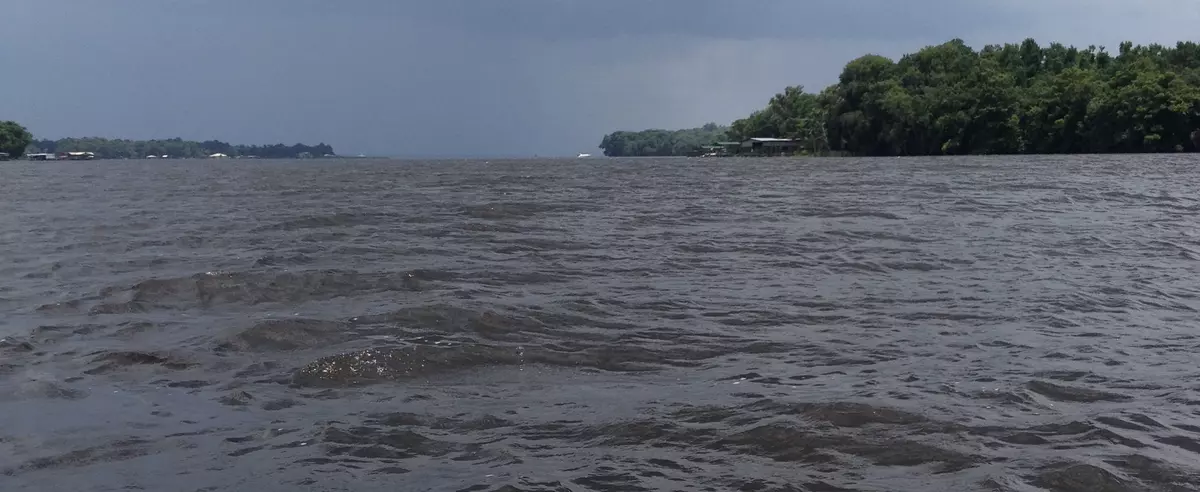
Analyzing dissolved oxygen data across a fresh-estuarine gradient of the Lower St. Johns River (FL, USA) using a Python-enabled Jupyter Notebook
Introduction
In this exercise, students will explore dissolved oxygen (DO) dynamics at three locations along a fresh-estuarine gradient of the Lower St. Johns River, FL (USA). Spatiotemporal DO trends along this gradient vary as a function of (1) tidal influence, and (2) biotic productivity (phytoplankton photosynthesis and community respiration). This combination of influences produces distinct DO behavior across each of the three hydrologically-connected sites. Through data analysis, students will have to think critically about the roles of physical and biological drivers of DO, and how the relative importance of these factors can vary among different locations within a single tidal waterbody. Data from each of the three locations along the river are downloaded from the CUAHSI HydroClient, and analysis is performed with a Python-enabled Jupyter Notebook that has been specifically created for this assignment. Jupyter Notebooks include annotated code that has been organized into blocks, which can be executed one-at-a-time. The output from each code block (i.e. graphs, tables) are produced within the Jupyter Notebook, thus allowing students to directly interact with the code. By the end of the assignment, students' understanding and appreciation should increase in the topics of spatiotemporal variability in tidal systems, DO cycling, coding for data management and analysis, and technical use of Python and Jupyter.
Intended Audience
- DO as an ecological indicator
- Processes driving diel DO cycling (photosynthesis, respiration)
- Correlation and cross-correlation
Conceptual Learning Outcomes
- Think critically about how hydrologic variability changes spatially in tidally-influenced systems
- Synthesize topics from physical and ecological sciences to evaluate how hydrologic and biotic factors influence DO
Practical Learning Outcomes
- Access and download data from CUAHSI HydroClient
- Use Python and Jupyter Notebooks to load data, plot data, and calculate simple multivariate descriptive statistics
Student Time Required
Supporting Reference Documents and Files
Instructions
- Data exploration and download with the CUAHSI HydroClient (students complete prior to class)
- Data cleaning in Excel (students complete prior to class)
- Data organization and analysis in a Python-enabled Jupyter notebook (students are led by instructor in-class)
- Discuss results in report format (students complete after class)
The Jupyter notebook included with this assignment can be edited to reflect the coding experience of participating students. For example, the instructor may decide to delete all code corresponding to the estuarine and transitional river reaches such that the students must write code for these sections on their own. Alternatively, the notebook can remain as-is so that students with no coding experience can be exposed to simple coding for data management and analysis (and see that there's nothing to be afraid of!). The assignment can be tailored in this way to accommodate students with zero to basic coding experience.
Experienced coders will not find this assignment challenging from a coding perspective, though the discussion should still prove stimulating. If the instructor would like to adapt this assignment to challenge advanced coders, students could be asked to expand the notebook to include more advanced time series analyses (i.e. multilinear regression, Granger causality, etc.).
Steps within this lesson
Assessment
Students are asked to write a report that summarizes the assignment, assimilates hydrological and ecological concepts, and extends assignment findings to real-world settings. Specifically, the report should include the following:
Introduction - why are DO dynamics important to study? What drivers control DO dynamics?
Methods
Study site - describe the Lower St. Johns River
Results - include screenshots of figures from Jupyter, describe important findings, etc.
Discussion - address the following questions:
- How do DO dynamics differ across upstream, transitional, and estuarine reaches?
- What seasonal variability is observed in the data? Does seasonal variation differ between the three reaches?
- Why do you think DO dynamics change between the upstream and estuarine sites? Support with your findings from the data analysis. Link this spatial variability back to the drivers you described in the Introduction.
- If you could supplement this analysis with additional data, which types of data would you choose, and why?
- What are the management implications of this spatial variability?
- After having searched for, downloaded, and analyzed real-world high-frequency data, describe what you consider to be challenges associated with long-term continuous monitoring of aquatic systems.


![[creative commons]](/images/creativecommons_16.png)