
Going Further
Variations
Note: This chapter was retired in July 2011. A similar EET chapter that uses the same data and ArcExplorer Java Edition (AEJEE) GIS software is available. See: Investigating Earthquakes with ArcExplorer GIS
Examples of datasets that can be investigated with the techniques of this chapter include: stream flow conditions, global land and sea surface temperatures, and many others with latitude and longitude coordinates, such as those gathered with a GPS. Specifically, data from the EET chapters Exploring Regional Differences in Climate Change and Using GLOBE data to investigate the Earth System can be brought into ArcView/ArcVoyager using the same procedures as in Parts 1 and 2 of this chapter.
Instead of limiting the data to the high magnitude earthquakes, one could investigate the low magnitude earthquakes.
Consider investigating other relationships in the earthquake data. Some questions to investigate might include:
- Where are really deep earthquakes located? Where are really shallow earthquakes located? Is there a relationship between depth and plate boundaries?
- Is there a relationship between the magnitude of an earthquake and its depth?
Other Techniques
Exploring a Year's Worth of Earthquakes (Symbolizing Earthquakes by Magnitude)
- Go to the USGS Earthquake cite and download all the earthquakes that took place during the past year. (If needed, refer to Part 1 for help.)
- Using the procedures in Part 2, format the earthquake data and save it as a tab-delimited or comma-delimited text file.
- Launch ArcVoyager/ArcView.
- Click the Add Table button
 to add the files of "GIS-ready" data that you just formated. Make sure the file type is set to Delimited Text or else the files will not be visible.
 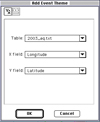 Choose View>Add Event Theme... to map the individual earthquakes of the table. All of the earthquakes are shown as the same size and same color, regardless of their magnitude.
- Symbolize the earthquakes by magnitude so that the bigger earthquakes are larger in size. Make the theme active and choose Theme>Edit Legend.... When the Legend Editor opens, change the Legend Type from Single Symbol to Graduated Symbol. Choose Magnitude for the Classsification Field. Click the Classify button. Change the Classification Type from Natural Breaks to Equal Interval. Click OK. Then be sure to click Apply in the Legend Editor dialog box.The map should now show Earthquake symbols of five different sizes.
- Experiment with changing the interval level or increasing the number of classes used to symbolize magnitude.
